A seasonality effect is a recurring time-related pattern that makes measurements vary across periods. Website visits may fall during a holiday lull and rise during a normal post-holiday surge. A graph showing increased traffic after a website launch therefore describes a change over time, but does not by itself show that the new site caused the increase. section 1.3.1
A misleading website launch comparison
Suppose a new website launches immediately after a holiday. Visits decline before launch and increase afterward, making the redesign appear successful. A stronger comparison checks visitor numbers from the same period last year, while recognizing that marketing campaigns, competitor mistakes, regulations, new hires, or broader socioeconomic changes may also affect traffic. section 1.3.1
Seasonality is consequently a variable to account for when evaluating an intervention or modeling engagement. For posts about sports, sports seasons may change audience interest independently of the post topic or advertising platform. The relevant seasonal pattern can also change with the year: events such as the Olympics, new stadium construction, or team changes may alter engagement. section 3.2.1
Use seasonality as a prompt to:
- Compare measurements across comparable periods, such as the same period last year. section 1.3.1
- List other influences before attributing a change to a website, post topic, or advertising platform. section 1.3.1 section 3.2.1
- Treat seasonal variation as part of the causal analysis rather than mistaking temporal correlation for an intervention effect. section 1.3.1 section 3.2.1
Figure 1.2 Comparison of website traffic before and after launching the new version. You want to figure out whether creating the new website was beneficial in terms of attracting more visitors.
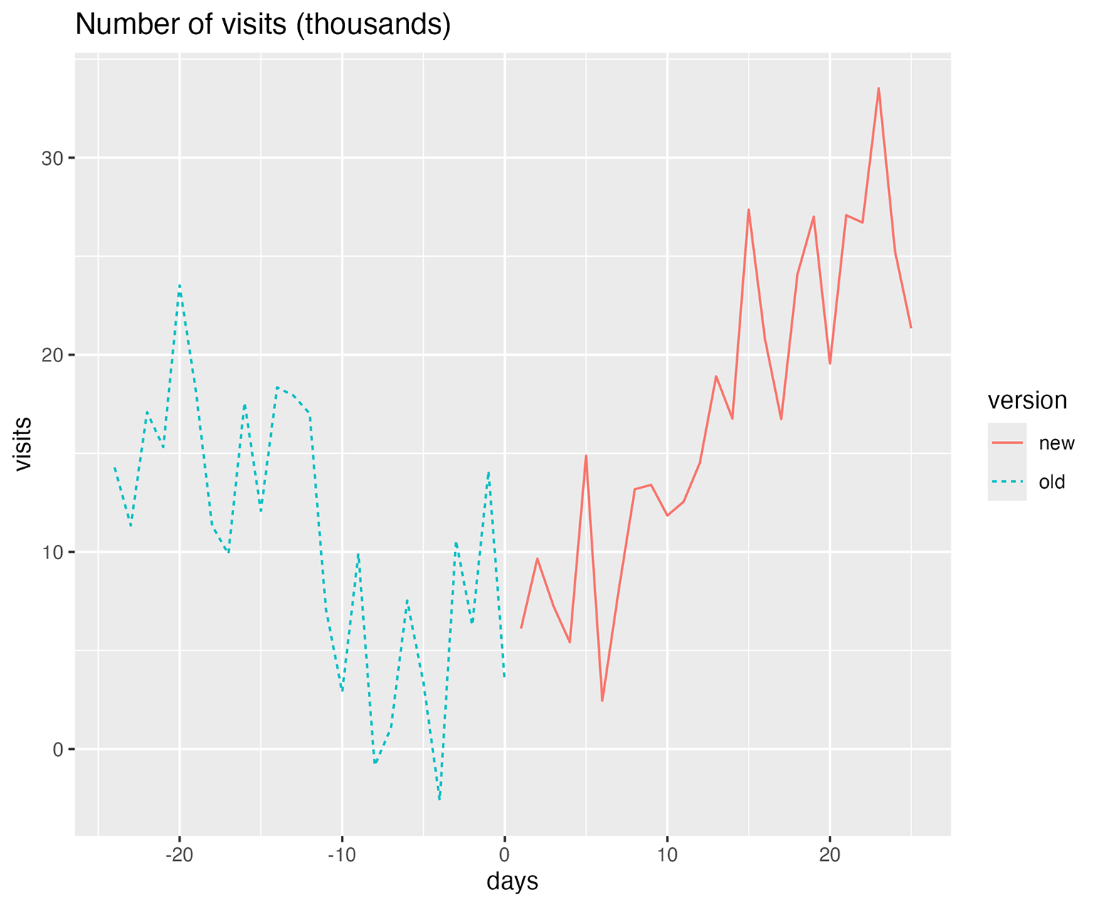
Inspect the website-traffic comparison to see why an increase after launch can reflect both the redesign and recurring time patterns. section 1.3.1







