liveBook · Manning

Seasonality effect

As explained in Time Series Forecasting Using Foundation Models

Seasonality is a recurring pattern in a time series associated with a fixed cycle, such as weekly, daily, or twice-daily repetition.

Defines seasonality as a recurring time-series pattern associated with a fixed cycle, such as daily, weekly, half-daily, or yearly repetition. section 3.2.1 section 9.1.2

Recognize seasonality through recurring patterns and their corresponding lags:

  • Maps a lag of 168 hourly observations to weekly seasonality, 24 to daily seasonality, and 12 to a complete cycle occurring twice daily. section 9.1.2
  • Uses fast Fourier transform analysis to identify prominent seasonal frequencies and help forecasting models capture recurring patterns. section 9.1.2
  • Distinguishes seasonality from other temporal effects: blog visits follow weekday-weekend repetition, while article publication produces short-lived traffic peaks. section 10.1

Seasonal-naïve baseline

Forecasts daily blog visits with a seven-day seasonal period by repeating the last seven observations. Evaluates the baseline with nonoverlapping seven-day cross-validation windows using MAE and sMAPE. section 10.2.2 section 10.1

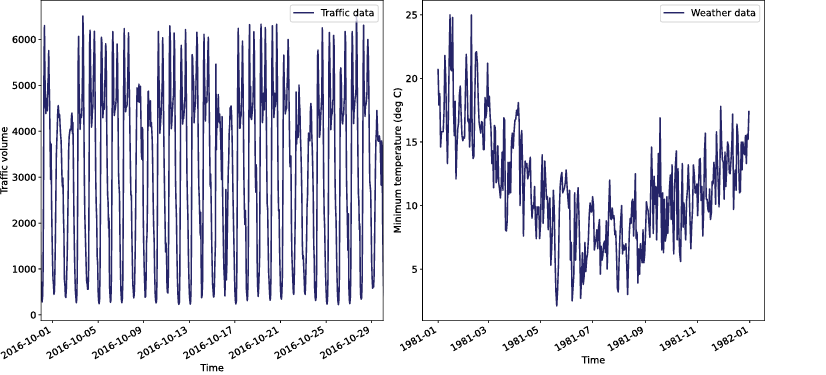
Figure 3.2 Different temporal patterns appear with different domains. (Left) Hourly traffic data shows a daily and weekly seasonality. (Right) Daily temperature data exhibits a yearly seasonality.
A blue lines on a white background

AI-generated content may be incorrect.

Compares daily and weekly seasonality in hourly traffic with yearly seasonality in daily weather, showing how domain and sampling frequency shape recurring cycles. section 3.2.1


How Time Series Forecasting Using Foundation Models covers it

How deep it goes
Explains cycles through concrete lags and forecasting procedures, but does not develop the underlying spectral mathematics.
Examples
Illustrates daily, weekly, half-daily, and yearly cycles through traffic, household energy, weather, store sales, and blog visits.
What it assumes
Assumes basic time-series sampling and forecasting knowledge while introducing seasonal periods through intuitive domain examples and lag calculations.
What you can do after
Apply it via statsforecast by configuring a seasonal-naïve period and evaluating forecasts with nonoverlapping cross-validation windows.
How it connects
Connects seasonality with time-series forecasting, lag features, fast Fourier transform, cross-validation, SARIMA, and foundation models.

Also explained in

Compare how 8 books explain seasonality effect →

Related concepts

This explainer was generated by Manning's knowledge graph from the text of Time Series Forecasting Using Foundation Models. The section links point to the parts of the book it draws on.





