Suppose each additional room adds about 50 to a house’s price. On a graph with rooms along the horizontal axis and price along the vertical axis, the price rises by 50 whenever the room count moves one step right. That rate of change is the line’s slope. section 3.2
Slope measures a line’s steepness: divide its rise (vertical change) by its run (horizontal change). The ratio stays the same wherever you measure it on a straight line. A horizontal line has slope zero; a line that falls as you move right has negative slope. A vertical line’s slope is undefined. section 3.2 section 3.3
In y = mx + b, m is the slope and b is the y-intercept—the height where the line crosses the vertical axis. Slope determines how much y changes when x increases by one; the intercept positions the line. For y = 0.5x + 2, each step right takes you 0.5 steps up, and the line crosses the vertical axis at 2. section 3.2 section 3.3
Figure 3.8 Some examples of slope and y-intercept. On the left, we see several lines with the same intercept and different slopes. Notice that the higher the slope, the steeper the line. On the right, we see several lines with the same slope and different y-intercepts. Notice that the higher the y-intercept, the higher the line is located.
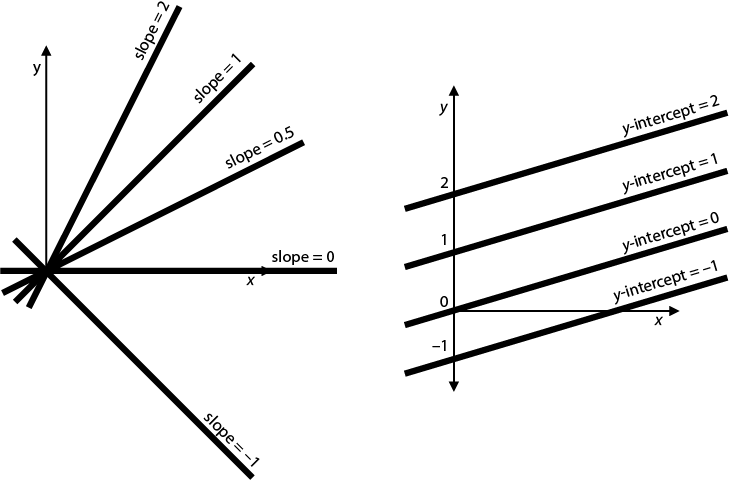
Compare lines that share an intercept but have different slopes, then lines that share a slope but have different intercepts. section 3.3
A price-per-room slope
For Price = 100 + 50 × Number of rooms, the slope is 50 and the intercept is 100. A four-room house has a predicted price of 300. Real prices need not land exactly on the line: a regression model aims to put its line close to the observed houses. section 3.2
In a one-feature linear regression model, slope is the feature’s weight. Adjusting that weight rotates the prediction line; adjusting the intercept, or bias, moves it up or down. Repeatedly moving the line toward observed points can produce a better fit. With several features, each feature has its own weight. section 3.2 section 3.3
Try fitting house price using only area, then inspect the fitted coefficient: it is the slope when area and price are plotted. In a Hyderabad housing example, that slope is 9664.97. Look at the points as well as the line; a slope alone cannot tell you whether individual predictions are close. section 3.5