Statistical analysis turns numerical data into insight by collecting, analyzing, interpreting, and quantifying evidence. It helps connect a sample with a larger population while keeping uncertainty, assumptions, and incentives in view. section 1.0 section 1.8
A practical analysis usually moves through four stages:
- Form a hypothesis about a relationship or explanation. section 1.7
- Gather representative data and assess its quality. section 1.7
- Fit a model that quantifies the relationship in the data. section 1.7
- Test the model on unseen data, measure errors, and check whether it generalizes. section 1.7
Do hotter days increase sports-drink sales?
Start with temperature as a possible sales driver, collect a sample, and use linear regression to fit a line between temperature and sales. Testing that line on new data may expose large errors, prompting questions about the model, the data, or other relevant variables. section 1.7
A statistical result is evidence, not an automatic truth machine. Sampling bias, ignored variables, aggressive outlier removal, incentives, and confusing statistical significance with real-world causation can distort a claim. Auditing methods and assumptions matters as much as reading the final number. section 1.4 section 1.8
Figure 1.1 An example of the four steps in applying statistical analysis to data, studying whether temperature affects sports drink sales
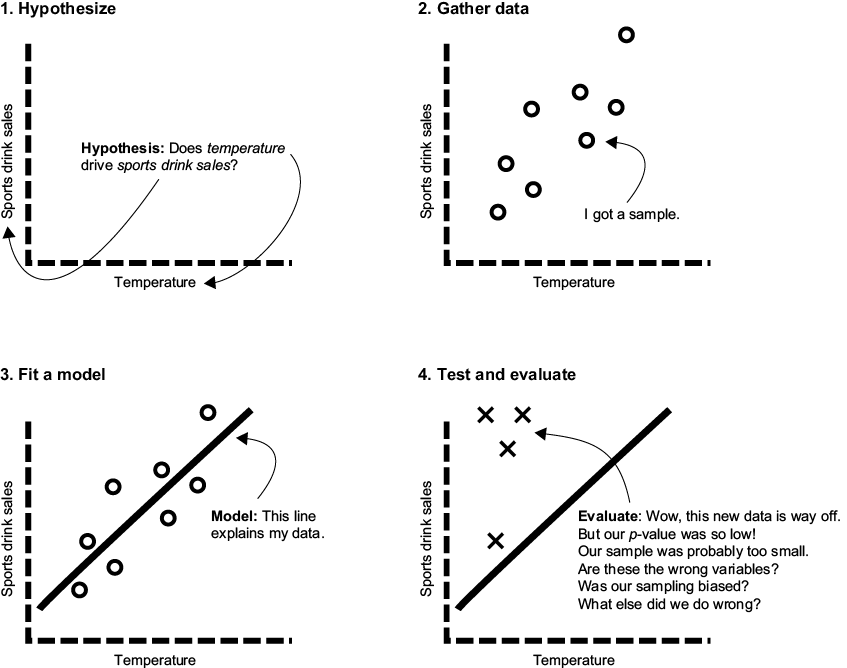
Use the four-stage diagram to trace how a hypothesis becomes a tested model, from choosing variables through evaluating unseen data. section 1.7
