A metric is a quantitative measure chosen to answer a question. In an organization, metrics track processes, activities, or outcomes over time. In statistical modeling, an evaluation metric helps assess a model’s fit or performance. The two uses serve different decisions: whether an organization is progressing toward a goal, and whether a model is useful for an analysis. section 7.0 section 9.4
Start with the decision, not the number. A performance metric can show progress toward a broad goal, while operational, customer, product, or market metrics provide a closer view of what may be happening. A change in revenue, for example, does not by itself explain its cause; related measures can help investigate possible contributing factors. section 7.1.1 section 7.1.2
To make an organizational metric useful:
- Give the concept a specific operational definition. “Customer satisfaction” might become the percentage of customers reporting that they were satisfied or highly satisfied. section 7.2.1
- Check that the data can be captured consistently, then set a relevant, achievable target and an appropriate time period. These are parts of the SMART framework: specific, measurable, achievable, relevant, and time-bound. section 7.2.1 section 7.4
- Examine historical trends and suitable benchmarks before interpreting progress. Check the calculation and display as well: a poorly constructed metric or chart can obscure the underlying trend. section 7.4 section 7.3
For a fitted regression model, evaluation metrics answer narrower questions. R-squared describes the proportion of outcome variation explained by the inputs; adjusted R-squared also penalizes added variables. The F-statistic tests overall model significance. Log-likelihood, AIC, and BIC support relative comparisons between model iterations, with AIC and BIC penalizing complexity. Residuals—the gaps between observed and predicted values—are a complementary diagnostic, not a substitute for interpreting those scores. section 9.4
Figure 9.11 A statsmodels summary output for an OLS regression predicting housing prices using the square footage and number of bedrooms.
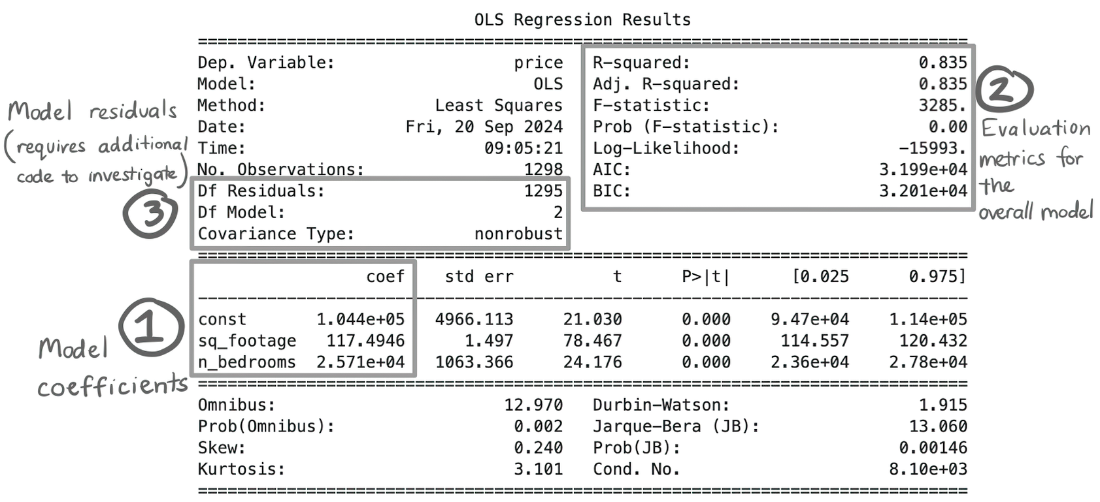
The regression summary makes evaluation concrete: a fitted housing-price model produces diagnostics alongside its coefficients. Read the scores in terms of the question each answers rather than treating one number as a complete verdict. section 9.1.2 section 9.4
Choose the measure before tracking it
Suppose a team wants to improve “website engagement.” Page views, session duration, and clicks offer different possible definitions. Decide which behavior matters, whether the available data captures it, what improvement would be meaningful, and whether progress should be assessed weekly, monthly, or quarterly. Naming the metric alone does not settle those choices. section 7.2.3