Telemetry is operational data that makes a software system’s behavior and health observable. In AI systems, it includes structured logs, aggregate metrics, distributed traces, generations, and quality scores. Observability collects this data to answer what happened, how long it took, what it cost, and how good the result was; unlike experimentation, it observes behavior without changing it. section 7.0 section 7.4 section 7.8
Telemetry combines complementary signals:
- Structured logs record detailed events and AI-specific attributes such as model, tokens, cost, and guardrail results. section 7.8
- Metrics aggregate behavior across requests: counters track totals such as requests and cost, while histograms capture distributions such as latency. section 7.5.2 section 7.8
- Traces follow a request across services; spans represent units of work, and generations represent LLM calls. Scores attach quality signals. section 7.4 section 7.8
Reliable collection keeps telemetry off the user’s critical path. Services create spans and propagate trace context automatically, then publish domain-specific data such as token counts, costs, and policy evaluations. A client buffers and batches delivery so publishing does not add network round-trips to individual requests. Logs link to traces through trace and span identifiers. section 7.5 section 7.5.2 section 7.8
Figure 7.1 Observability and experimentation architecture, spanning this chapter and the next. Platform services (left) emit logs, metrics, spans, and generations into the Observability Service (right), which routes them to four specialized stores. The SDK's ObservabilityClient buffers and flushes telemetry from developer workflow code. Dashboards and alerts consume traces, metrics, and scores. The Experimentation Service (bottom, built in the next chapter) evaluates production traces and writes the resulting quality scores back to the Score store.
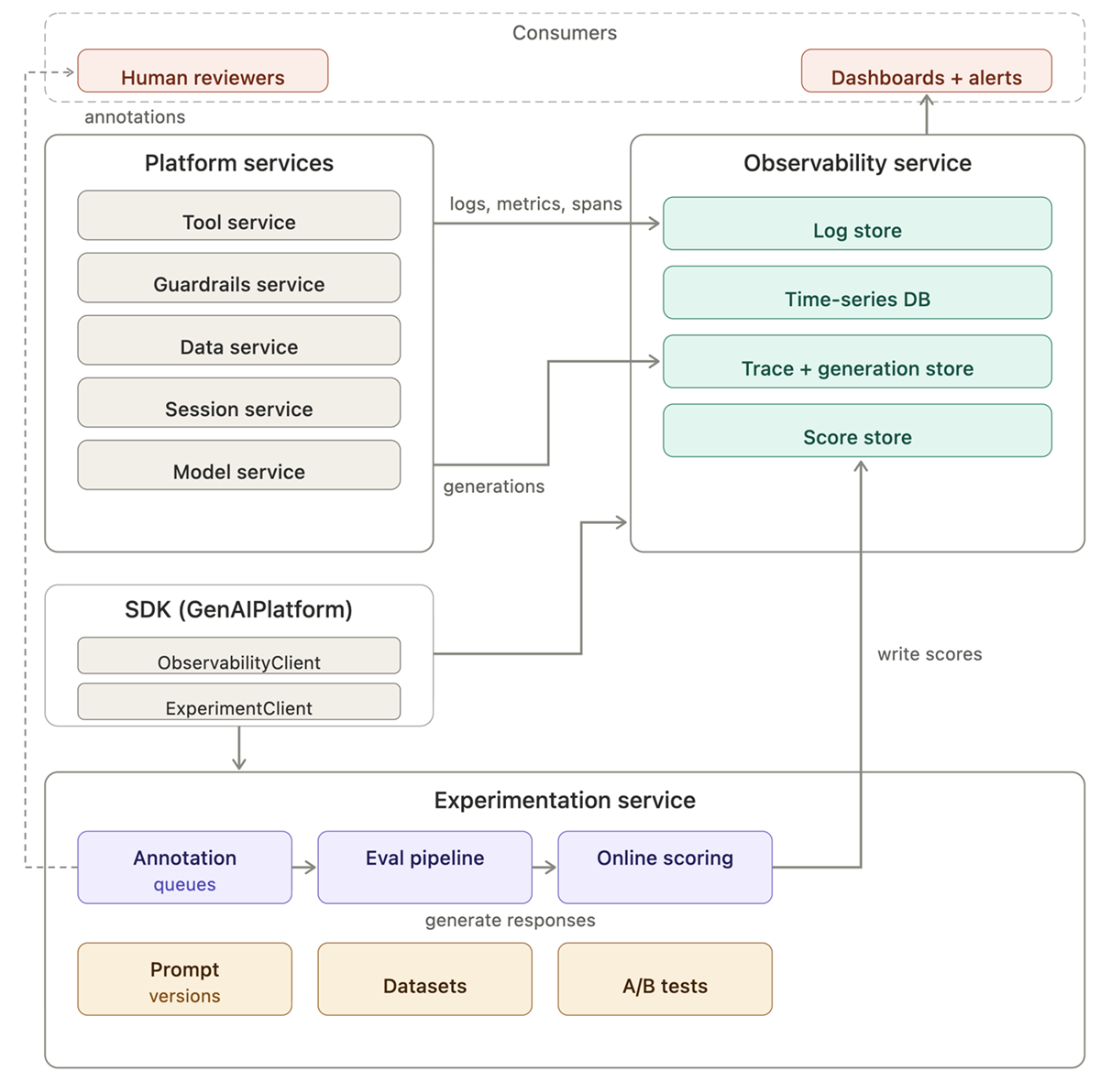
Follow how platform services and SDK workflows send telemetry to specialized stores, and how dashboards and alerts consume it. section 7.0
Model request metrics
A model service can increment a request counter, record request duration in a histogram, and accumulate cost. Labels such as provider, model, workflow, and cache status support breakdowns across requests. section 7.5.2