A time series is data presented over time, usually with time on the x-axis. It makes changes, trends, and trajectories visible for interpreting metrics and supporting stakeholder decisions. section 7.3.2
Analyzing a time series means examining how a measure changes across periods, while also checking anomalies, segments, aggregation choices, and relationships with other measures. Historical behavior helps assess whether targets are achievable and whether the chosen time interval will remain useful. section 7.2.2
Useful time-series views include:
- Plotting a line for each segment clarifies growth trajectories between groups over time. section 7.3.2
- Separating data by year and month helps investigate recurring seasonal patterns. section 7.2.2
- Choosing axis limits carefully prevents small fluctuations from appearing exaggerated or disappearing entirely; logarithmic scales require caution. section 7.3.2
- Comparing regions or other segments prevents an aggregate trend from hiding meaningful differences. section 7.2.2
Customer activity over time
A customer-login dataset records month, region, and login days. Converting month values to dates, calculating the percentage of days active, and plotting monthly regional averages produces a time series that supports comparisons across regions and years.
Figure 7.22 Line graphs are typically easier to interpret when visualizing trends between groups over time.
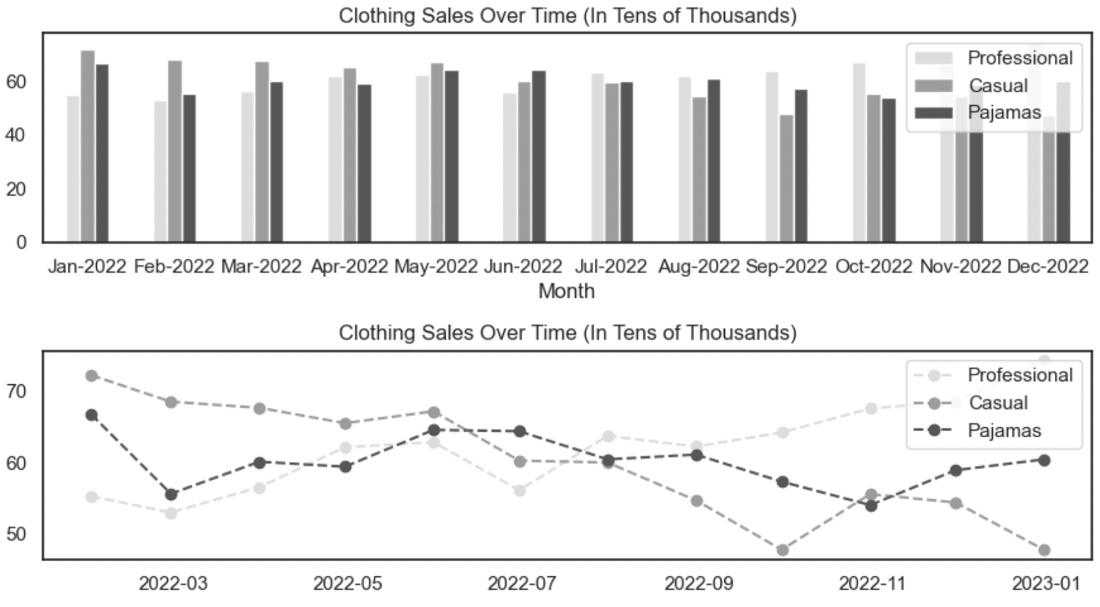
Use the line-graph comparison to see why separate lines can make group trends easier to interpret over time than grouped or stacked bars. section 7.3.2