A time series is a sequence of measurements ordered at regular time intervals, typically recording one variable for one entity. Unlike cross-sectional data, its ordering carries meaning. section 17.1
Distinguish time-oriented data structures by what their rows represent:
- Cross-sectional data records many entities without timestamps that define the observations’ order. section 17.1
- Time-series data records one entity at multiple, usually regular, time points, often using timestamp and measurement columns. section 17.1
- Panel data records multiple entities repeatedly over time and combines cross-sectional and time-series perspectives. section 17.1
Reformatting tabular records as a time series can expose patterns hidden in individual rows. Filter transactions, index them by datetime, resample them into daily totals, and compare sales, purchases, or their difference. section 17.0 section 17.1
Operational monitoring
Monitor industrial sensor readings against a baseline of normal operation. A temperature sequence may be anomalous when it fluctuates unusually often, even though no individual reading is extreme; repeating or escalating patterns can guide alerts and investigation. section 1.1.5
Figure 1.1 Temperature readings from sensor data presented as a time series. The x-axis tracks time in seconds and the y-axis tracks the temperature. There is an unusually high level of fluctuation at 200 seconds and an usually low level at 800 seconds.
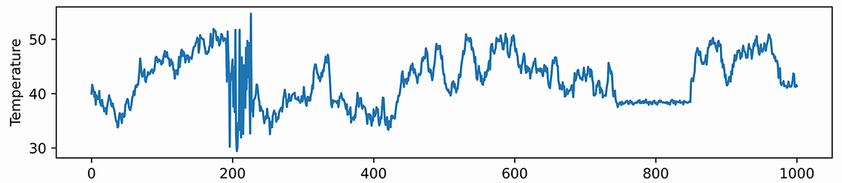
Use the sensor plot to inspect how unusually high or low fluctuation becomes an anomaly across time. section 1.1.5