A time series is a sequence of observations indexed or ordered by time. In business analysis, plotting activity over time can reveal operational phases, errors, outliers, and changes that a single summary conceals. section 2.6.2
Use an iterative inspection workflow:
- Visualize date-related variables and look for outliers, while checking whether unusual values represent data errors or meaningful business events. section 2.6.2
- Aggregate observations at a useful frequency, such as daily or monthly, to expose activity phases and changing distributions. section 2.6.2
- Test for cyclicity and treat exploratory data analysis as a recurring part of deeper analysis rather than a one-time handoff. section 2.6.2
- Avoid interpreting ordinary correlation too quickly: autocorrelation, trends, seasonality, and external shocks can produce misleading relationships. section 2.6.3
Review activity and response delay
Monthly review counts can distinguish weak initial activity from rapid growth and later changes. To investigate whether review creation and answer timestamps are related, calculate their time difference, summarize it, and inspect a histogram and box plot. A large maximum relative to the quartiles warrants checking unusual records rather than assuming a causal relationship. section 2.6.2 section 2.6.3
Figure 2.3 The number of reviews over time—monthly aggregation
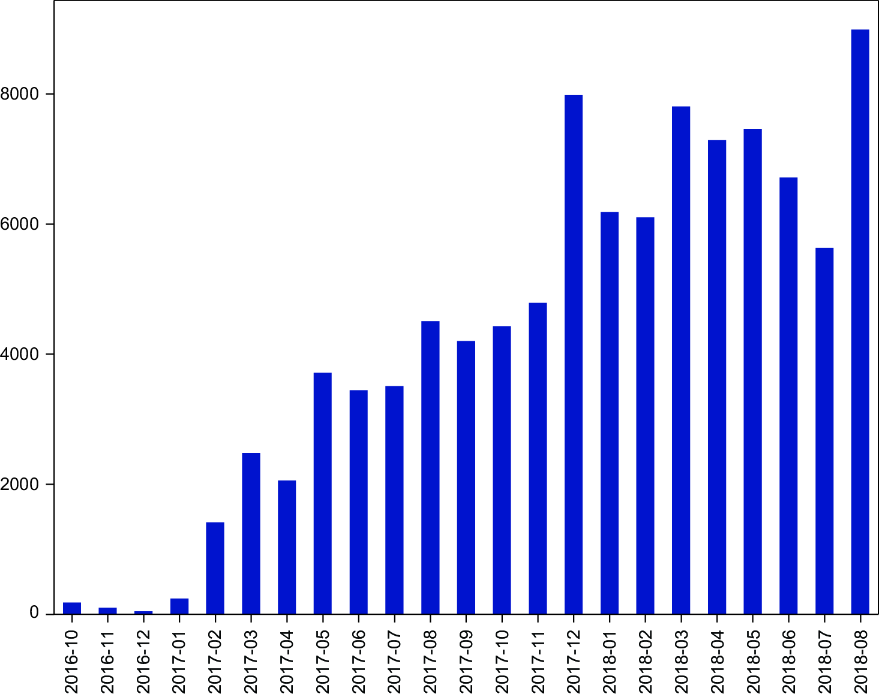
Browse the monthly aggregation showing how review volume changes across time. section 2.6.2