Forecast bias is the average direction of forecast errors: it reveals whether forecasts systematically overestimate or underestimate demand. It complements accuracy, which measures error magnitude but not direction. A useful forecast needs both dimensions, along with the right objective, data, granularity, and horizon. section 8.1 section 1.3
Start with the business question: what decision will the forecast support, and what is the cost of being consistently too high or too low? A bias near zero is generally preferable, but zero bias alone does not make a forecast good. Positive and negative errors can cancel over time, leaving a low average bias even when individual errors are large. section 8.1 section 8.2.3
Compute the error for each period as forecast minus demand: eₜ = fₜ − dₜ. A positive error means the forecast overshot demand; a negative error means it undershot. Bias is the average error across multiple periods: sum the errors and divide by the number of periods. Assessing several periods matters because a persistent pattern can signal a problem in either the forecasting engine or the planning process. section 8.2
Four-period calculation
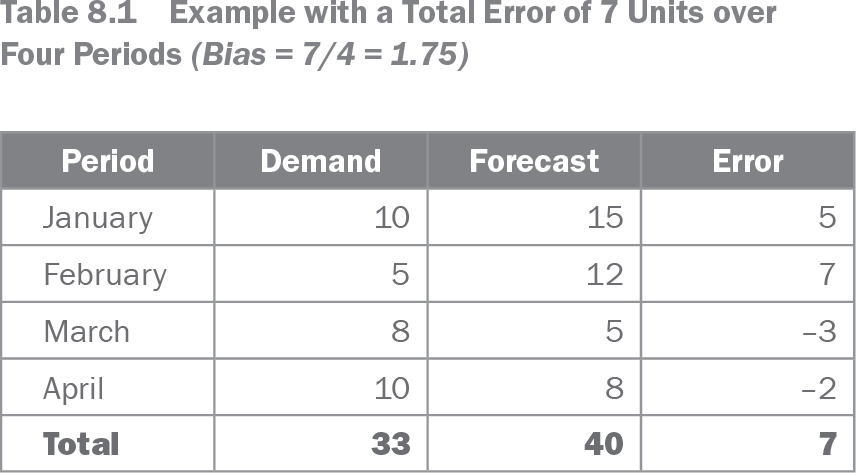
Suppose demand is 10, 5, 8, and 10 units, while forecasts are 15, 12, 5, and 8. The errors are +5, +7, −3, and −2, for a total of +7. Dividing by four periods gives a bias of +1.75 units: forecasts were high on average. section 8.2
Table 8.1 Example with a Total Error of 7 Units over Four Periods (Bias = 7/4 = 1.75) (view table figure)
| Period |
Demand |
Forecast |
Error |
|---|---|---|---|
| January |
10 |
15 |
5 |
| February |
5 |
12 |
7 |
| March |
8 |
5 |
–3 |
| April |
10 |
8 |
–2 |
| Total |
33 |
40 |
7 |
Inspect the period-by-period demand, forecast, and error table to see how positive and negative errors accumulate into average bias. section 8.2
Bias and accuracy can conflict. An inaccurate but unbiased forecast may create variation for the supply chain, while an accurate but biased forecast may send a poor production signal and contribute to lost sales. The preferred choice depends on operational consequences rather than a universal metric ranking. section 8.1
Use bias as part of a practical review routine:
- Calculate errors over the same relevant periods and average them; when expressing bias as a percentage, divide average error by average demand for those corresponding periods. section 8.2.2
- Track bias alongside MAE rather than treating either measure as sufficient. MAE captures error size; bias captures systematic direction. section 9.3
- Review relevant forecast lags, not only one lag. Analysts may inspect each lag, while management may need an aggregated scorecard. section 9.3
- Investigate sustained bias in data, assumptions, adjustments, and stakeholder incentives—not just in the statistical model. section 16.2.3
Process bias can originate in one-sided information or unequal scrutiny of forecast changes. Looking only at constrained sales rather than unconstrained demand can create biased inputs; emphasizing store closures but not openings, or marketing activity but not competitors’ actions, creates similar blind spots. Requiring justification mainly for downward changes can encourage over-forecasting, while penalizing historical over-forecasts can make planners conservative. section 16.2.3
Choose metrics that fit business value. MAE and bias offer a simple, robust combination for assessing forecast quality; for products with widely different prices, value-weighted metrics can better reflect business impact. A combined score of MAE plus absolute bias can compare forecasts, but presenting the two measures separately is often clearer for management. section 9.3 section 14.4.1