Bias is a systematic tilt that can make data or predictions misleading. In data collection, it appears when a sample does not represent the population because some groups or conditions are overrepresented while others are missed. In modeling, bias means something different: a model follows a rigid rule that may not bend enough to reflect the data. Keeping these meanings separate prevents a lot of confusion. section 2.7 section 7.10
Think of data as family photos. A photo collection may show happy, staged moments while leaving out ordinary or difficult ones. The photos are real, but they are incomplete evidence for a broad claim about someone’s life. Start with a focused question, then collect information suited to that question rather than treating whatever is available as the whole story. section 2.2
Sampling bias commonly enters through choices about who, what, and where to measure:
- A dormitory sleep survey cannot automatically represent every student on campus or nationwide; a new target population needs a new sample across that population. section 2.7
- Voluntary participation can create self-selection bias when people opt in or out for reasons related to what is being measured. section 2.7
- A measuring technique can skew results: squeezing calipers too hard may compress 3D-printer filament and underestimate its diameter. section 10.21
- Sampling only one short stretch of a filament spool can fail to represent the entire spool. section 10.21
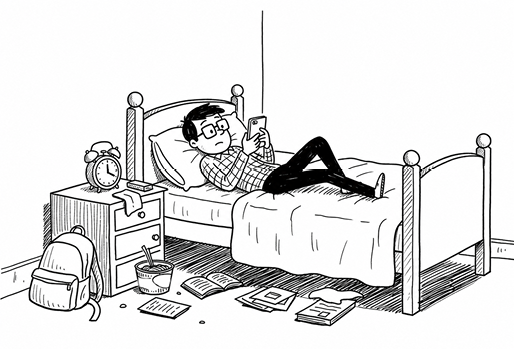
Use the sampling-bias figure to contrast a narrowly available group with the larger population a claim tries to describe. section 2.7
To investigate bias, do not stop at the numbers. Ask what was measured, who created the data, where and when it was gathered, why it was gathered, and how it was gathered. Also look for missing context, changing conditions, incentives, confounding variables, cherry-picking, and confirmation bias. A precise-looking metric can still reflect a distorted process. section 9.16 section 10.19 section 10.1
A model can be biased on purpose
A linear regression model uses a straight line even when the observed data might invite more bends. That rigidity is model bias, not biased data. It can be useful for prediction because a very flexible model may memorize noise in past data and make unstable predictions on new data. Lowering model bias generally gives the data more influence, but can raise variance; the practical task is balancing generalization against flexibility. section 7.10
Bias is also about the limits of a claim. A toddler-meltdown model built from one child’s pre-nap observations can describe that child in that setting, but it should not be generalized to all children. State the population, conditions, and time window that the data actually supports. section 8.2