Suppose a house-price model predicts 100 plus 50 for each room. The 50 tells you how much the predicted price rises with another room. What does the 100 do? It sets the starting height of the prediction line. section 3.2
The intercept, also called the y-intercept or bias, is where a line crosses the vertical axis. In y = mx + b, b is the intercept: when x is zero, mx is zero, so y equals b. For a model with several features, the bias is the prediction when all feature values are zero. The slope m is different: it controls how much the prediction changes as x increases. section 3.2
Figure 3.8 Some examples of slope and y-intercept. On the left, we see several lines with the same intercept and different slopes. Notice that the higher the slope, the steeper the line. On the right, we see several lines with the same slope and different y-intercepts. Notice that the higher the y-intercept, the higher the line is located.
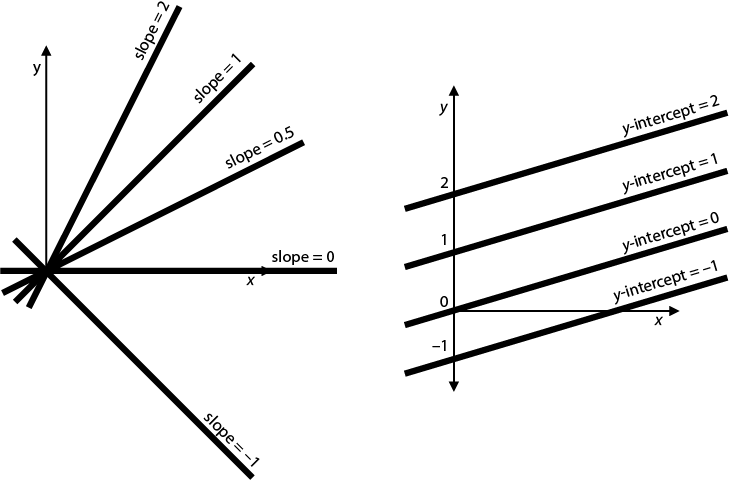
Compare the lines on the right: they have the same slope, but a higher intercept places the whole line higher. section 3.3
A house-price prediction
For Price = 100 + 50 × (number of rooms), the intercept is 100 and the slope is 50. A four-room house has a predicted price of 300. In a less tidy dataset, actual prices do not fall exactly on this line; the line gives predictions that can have small errors. section 3.2
Fitting a regression line means adjusting both its slope and intercept to bring it closer to the observed points. Changing the intercept moves the line up or down; changing the slope rotates it. In the square-trick update, the model first predicts a price, then adjusts its base price—the intercept—using the difference between the actual and predicted prices. section 3.3
You can also inspect a fitted intercept rather than calculate one by hand. In an area-only model for Hyderabad house prices, Turi Create reports an area coefficient of 9664.97 and an intercept of −6,105,981.01. The coefficient is the line’s slope; the intercept is its bias. Try fitting an area-only model and inspecting its coefficients, then compare the weights when you include other available features. section 3.5






