liveBook · Manning

Label

As explained in Grokking Statistics

A categorical value assigned to an observation to represent its class or outcome.

A label gives an outcome a simple category. In a two-outcome experiment, 0 can represent failure and 1 can represent success, making the result easy to store, compare, and assign a probability. section 3.5

A soaked laptop

Suppose a spilled-on MacBook has a 70% chance of recovering. Label recovery success as 1 and failure as 0. The corresponding probabilities are P(X=1)=0.70 and P(X=0)=0.30, which add to 1.0. section 3.5

Figure 3.1 Visualizing the Bernoulli distribution
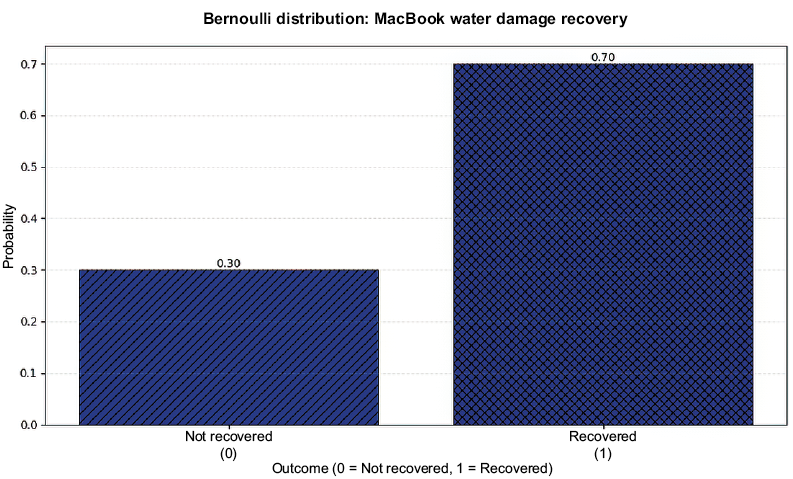
A bar chart makes the two labeled outcomes and their unequal probabilities visible. section 3.5


How Grokking Statistics covers it

How deep it goes
Explains binary encoding, probability lookup, plotting, and simulation, then stops before multiple-outcome distributions.
Examples
Uses MacBook recovery, a two-bar chart, a probability dictionary, and NumPy random sampling.
What it assumes
Starts from an everyday recovery scenario and teaches binary labels and probabilities without requiring prior formal notation.
What you can do after
Apply it via Python, plotting binary labels, looking up their probabilities, and simulating outcomes with NumPy.
How it connects
Connects labels with Bernoulli distribution, probability distribution, random variables, and discrete distribution.

Also explained in

Compare how 20 books explain label →

Related concepts

This explainer was generated by Manning's knowledge graph from the text of Grokking Statistics. The section links point to the parts of the book it draws on.

















