Orchestration coordinates what happens next in a multi-step system. In financial AI, it selects tools for a query; in quantitative research, it manages dependent pipeline jobs. section 3.2.1 section 10.3.1
Two production workflows use orchestration to keep work moving:
- For a new or complex financial query, retrieve relevant documents, call an internal API for current data, then prepare a prompt for the language model. section 3.2.1
- For quantitative research, coordinate ingestion, validation, normalization, enrichment, feature generation, backtesting, and reporting; retry failed jobs, scale resources, and monitor execution. section 10.3.1
Figure 10.3 Conceptual architecture for an institutional quantitative research pipeline. This shows how a production-grade pipeline expands beyond simple data download into source diversification, quality gates, enrichment, orchestration, parallel processing, and research-ready analytical storage.
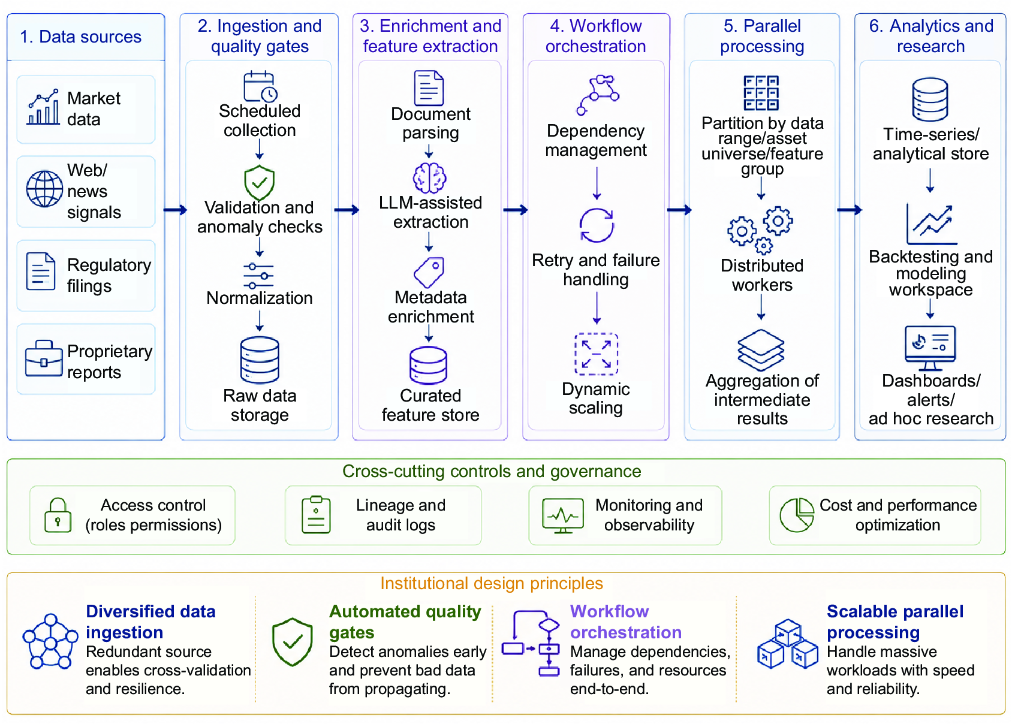
See how orchestration fits among quality gates, enrichment, parallel processing, and analytical storage in an institutional research pipeline. section 10.3.1