An event stream records what happened, but answering “what is the current balance?” by replaying every transaction is expensive. Aggregation maintains a summary as new data arrives. Grouping transactions by account ID and summing their amounts produces a separate current balance for each account. section 12.4 section 12.4.2
A streaming aggregation needs two pieces:
- An initial state for a key with no previous result: 0 for a count or sum, 1 for multiplication, or an empty collection when collecting items. section 12.4.2 section 12.4.4
- An adder that combines the previous state with each incoming value. A count adds 1; a sum adds the value. The updated result is retained per key. section 12.4.2
Count and sum by key
For the observations (K1, 2), (K2, 1), and (K2, 2), a count yields K1: 1 and K2: 2. A sum yields K1: 2 and K2: 3. An average needs more state than the displayed average alone: the example tracks sum and count so each new value can update the result. section 12.4.2
Figure 12.8 To count the number of messages per key, a state store with the current count per key is needed. The changes to the state store are stored in a compacted changelog topic.
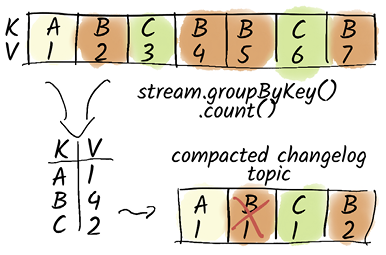
The count diagram shows the operational detail behind the result: a state store holds each key’s current count, while a compacted changelog topic records changes so the state can survive a processor crash. section 12.4.2
The same pattern can maintain a list of active devices for each user. Start with an empty list, add active devices, remove inactive ones, then join the resulting table with incoming notifications. Kafka Streams provides groupByKey().aggregate() for this flow; Flink SQL can express the grouped device view with GROUP BY. section 12.4.4
Metric aggregation serves a related operational purpose. A CPU-utilization spike to 100% may be harmless if brief, so visualizing and smoothing fluctuations over a longer period can help choose a useful alert threshold. Begin conservatively and adjust thresholds if false alarms are frequent; not every useful diagnostic metric needs its own alert. section 15.4.1 section 15.4