Debugging systematically locates, diagnoses, and corrects software defects. Logs identify responsible services and code, provide change context, and support testing, outage response, and security investigation. section 2.3.4
In distributed systems, debugging uses complementary signals:
- Distributed tracing reveals failing services, request-path latency, and release impact through service maps and spans. section 8.1.3
- Failure spans expose error codes and execution durations, letting operators compare broken requests with a healthy baseline. section 8.2.4
- Continuous profiling helps investigate resource and performance problems, while its production impact requires caution. section 9.1.5
Failure-trace workflow
Filter Jaeger spans by an HTTP error status or error=true, open the marked failing span, inspect its service and error code, and compare its duration with the happy-path baseline. section 8.2.4
Figure 8.7 Troubleshooting the demo microservices app: an example failure trace and the span that caused the failure
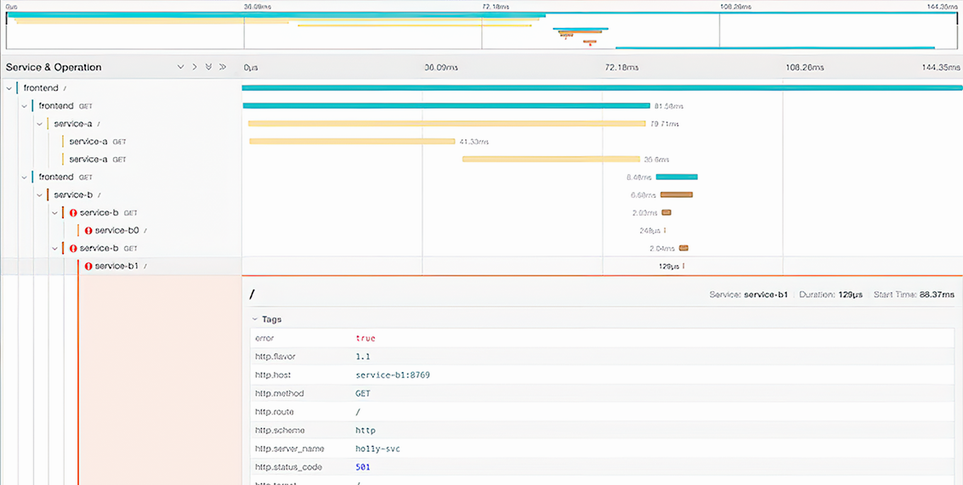
Use the failure-trace figure to connect a visible service error with the span that caused it. section 8.2.4