A false positive is an A/B-test decision that treats a variant as better when it is not. In a trading-routing decision, it means switching from ASDAQ to BYSE even though BYSE does not truly have lower expected costs. It is a controlled risk, not proof: a result beyond the significance threshold triggers an action while retaining a stated chance of being wrong. section 2.3.1 section 2.3.3
The false-positive rate is set by the decision threshold. With a unit-normal z score and a one-sided threshold of z < -1.64, 5% of measurements fall in the action region under the no-improvement assumption. Moving the threshold right raises false positives; moving it left lowers them. The normal approximation improves as the aggregate contains more individual measurements. section 2.3.1
Design and run tests so the stated error rate remains meaningful:
- Choose a practically significant cost difference and estimate per-measurement variation, potentially from a pilot study. section 2.3.2
- Set the required sample size before measuring; seven measurements in the illustrated design limit false positives to 5%, while adding a 20% false-negative limit requires more observations. section 2.3.2
- Randomize each incoming order between alternatives and collect at least the designed number of measurements to reduce bias. section 2.3.3
- Prespecify the business metric. Selecting a favorable metric after examining many metrics turns a single-metric 5% rate into a much larger family-wise risk. section 8.3.1
Checking a lower-cost routing result
Compute the aggregate cost difference, delta = mean(BYSE) − mean(ASDAQ), then divide by its standard error to obtain z. An observed delta of about −2.7 mips is practically significant when the target is 1.0 mip; z ≈ −6.35 also passes the −1.64 statistical threshold. Routing all trades to BYSE is then justified as a decision, while acknowledging the designed 5% false-positive risk. section 2.3.3 section 2.3.1
Figure 8.4 The probability of any one of a family of metrics generating a false positive versus the number of metrics, M, in the family
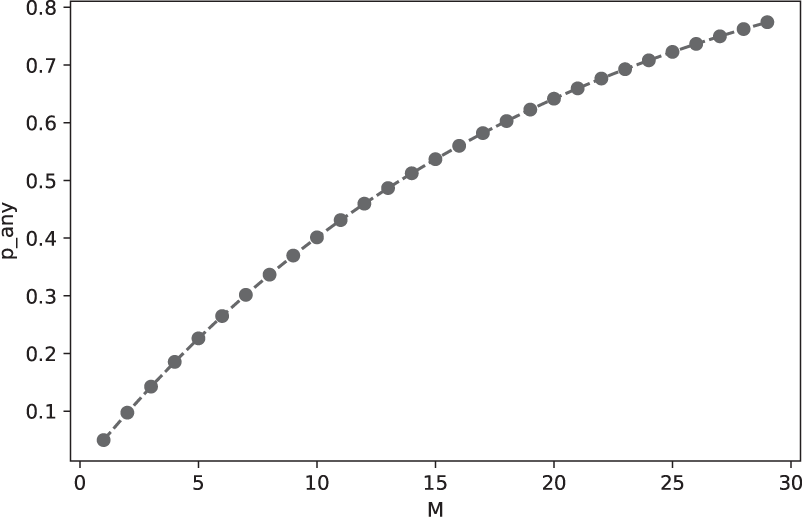
Compare the probability that at least one metric produces a false positive as the number of examined metrics grows. section 8.3.1