Filtering restricts a report or dashboard to the records most relevant to a question. In self-service analytics, filters and parameters let stakeholders explore subsets independently, such as customers by subscription type or location. section 12.3.1
Effective filtering depends on choosing inputs that support stakeholder decisions:
- Select meaningful dimensions, such as subscription type or customer location, rather than exposing every available field. section 12.3.1
- Combine filters with visualizations and grouping variables so users can examine metrics from several useful angles. section 12.3.3
- Document filters clearly and arrange them in a logical flow, helping new users work with dashboards confidently. section 12.3.3
Dashboard filtering exercise
Build a dashboard with two to four visualizations, then add filters for valuable stakeholder dimensions. Include clear labels and instructions, publish the dashboard to a public cloud, and request peer feedback. section 12.3.3
Figure 12.7 Adding information about your data and self-service tools to new employee onboarding documentation can help maximize their visibility.
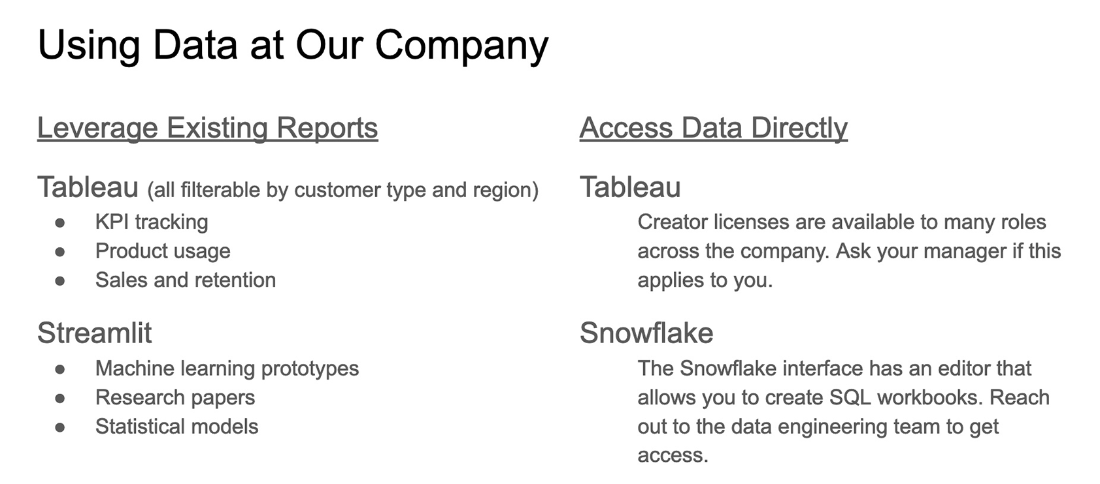
Use onboarding documentation to make filtering and self-service tools visible to new employees. section 12.3.1