A histogram groups numeric observations into intervals and displays their frequencies as adjacent bars. In financial analysis, it is especially useful for viewing the distribution of an asset’s returns. section 10.1.4
Plotting returns as a histogram helps assess whether they resemble a Gaussian distribution. A balanced curve can support that interpretation, but the chart remains a descriptive check rather than a guarantee about future performance. section 10.1.4 section 10.4
Apple returns
A histogram of Apple’s returns over time illustrates how observations cluster across intervals and provides a visual test for approximate normality. section 10.1.4
Figure 10.16 This shows a histogram of Apple’s returns over time, indicating that the returns of Apple follow a normal distribution, which, in other words, means there’s no need to worry about the stock’s performance.
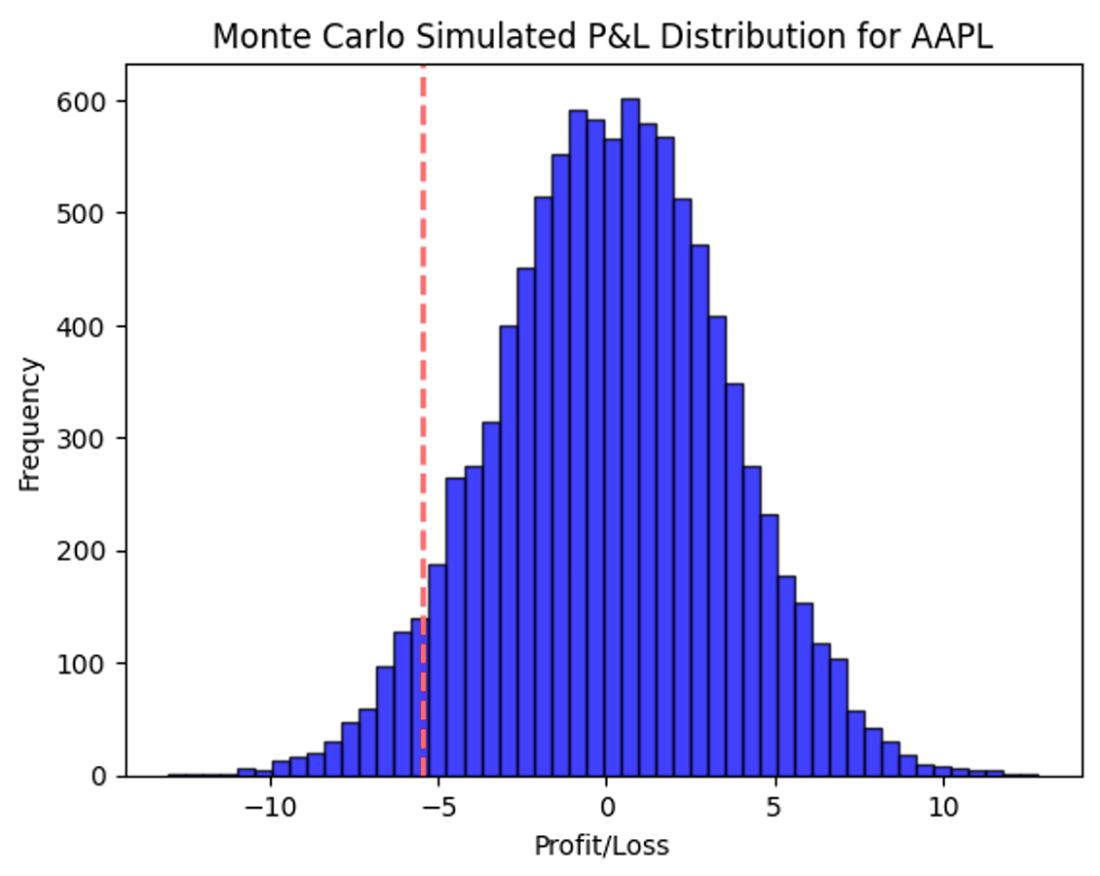
Inspect the return bars and their overall shape to evaluate how closely the observations follow a normal distribution. section 10.1.4