A key performance indicator (KPI) is an important business-performance indicator selected to track progress toward organizational objectives. Unlike a general metric, it focuses attention on priorities that matter most for decision-making. section 1.1.1
KPIs support business intelligence by turning performance data into reports and dashboards that stakeholders can consume, interpret, and use for decisions. Organizations may combine standard metrics with custom KPIs tailored to their needs. section 1.1.1
Accountability KPIs make expectations and progress visible at several organizational levels:
- Track the percentage of customer tickets resolved within 24 hours. section 7.1.3
- Compare each sales representative’s quarterly quota attainment. section 7.1.3
- Measure recruiters’ average time to fill roles, engineers’ bug-resolution time, or qualified leads from marketing campaigns. section 7.1.3
Support-team KPI
A support team can graph ticket-resolution performance over time against a 12-hour service-level threshold. The target makes current performance and potential shortfalls easy to interpret.
Figure 1.1 Line graph of a support team KPI with a threshold for the service level agreement (SLA) for resolving tickets in less than 12 hours. Metrics and KPIs generate value when tracked over time.
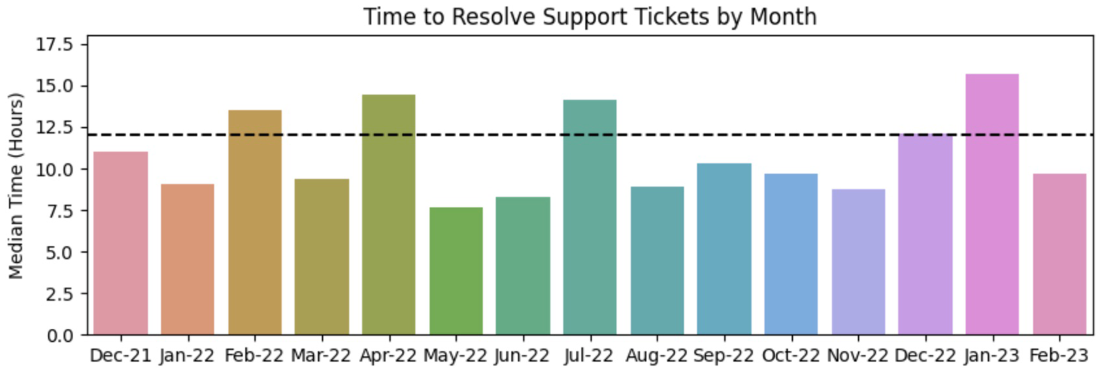
Browse the support-team KPI graph to see how tracking performance against a target supports interpretation and decision-making. section 1.1.1





