When a model moves its line toward a data point, should it jump directly there or take careful steps? A learning rate answers that question. It is a small positive number chosen before training that limits how much the model changes at each update. In linear regression, it scales the correction applied to the line’s y-intercept and slope, helping the line move gradually toward the data. section 3.3
Figure 3.6 An illustration of the linear regression algorithm. We start at the top left with a random line and end in the bottom left with a line that fits the dataset well. At each stage, two things happen: (1) we pick a random point, and (2) the point asks the line to move closer to it. After many iterations, the line will be in a good position. This figure has only three iterations for illustrative purposes, but in real life, many more iterations are needed.
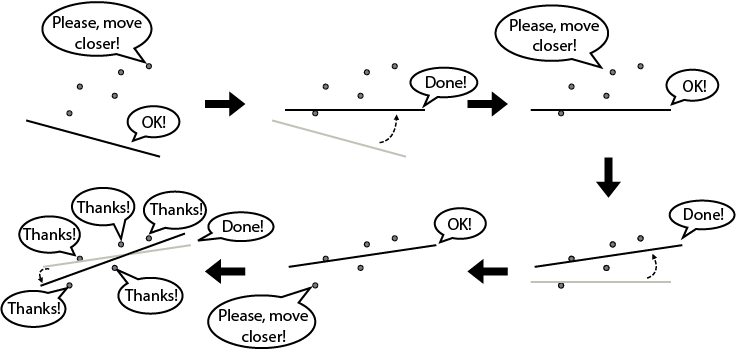
Follow the line’s repeated adjustments from a random starting position toward a better fit; each update represents a small move influenced by the learning rate. section 3.3
The same idea appears in two update patterns:
- Linear regression multiplies the prediction error by the learning rate before adjusting the base price, and also multiplies the error by the number of rooms when adjusting the price-per-room slope. section 3.3
- Gradient boosting multiplies each new tree’s prediction by the learning rate before adding it to the combined prediction, so successive trees contribute partial corrections. section 12.4
Two concrete settings
A linear regression routine can receive learning_rate=0.01 while repeatedly selecting training examples and applying the square trick. A gradient boosting regressor can use learning_rate=0.8 with four trees of maximum depth two; the second tree’s prediction is multiplied by 0.8 before joining the first tree’s prediction. section 3.3 section 12.4