Logistic regression classifies two outcomes, such as 0 or 1, by passing a linear combination of features through the sigmoid function. The result is a probability between 0 and 1. Its linear predictor represents log-odds: ln(p/(1−p)) = β0 + β′x. The Bernoulli distribution models the yes/no target, making the method suitable for binary classification. section 7.1.3
Read a fitted model through its additive feature weights:
- A positive weight increases the predicted log-odds and therefore increases the odds of the positive class. section 9.1.3
- Increasing a feature by one unit multiplies the odds by the exponential of its weight; a weight of 0.5 multiplies them by about 1.65. section 9.1.3
From diagnosis to implementation
For diabetes diagnosis, age and blood-glucose measurements can form an additive predictor of positive-diagnosis log-odds. A practical breast-cancer workflow standardizes the data, splits it into training and test sets, fits scikit-learn's LogisticRegression with L1 penalty and the saga solver, predicts test labels, and examines feature weights. section 9.1.3
Figure 7.5 Logistic regression (left) fits 0/1-valued targets by assuming that the spread of the targets can be modeled by the discrete-valued Bernoulli distribution (right). Observe how the prediction probabilities (the heights of the bars) of Class 0 and Class 1 change with the data.
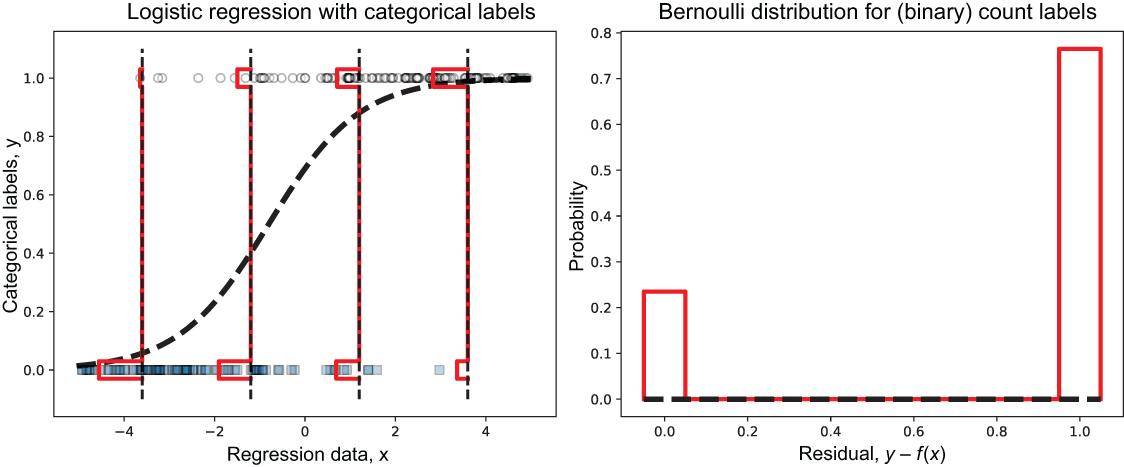
Use the figure to see how class-0 and class-1 prediction probabilities change across a one-feature dataset under a Bernoulli model. section 7.1.3











