Logistic regression helps answer yes-or-no questions with a probability first. Rather than predicting a continuous value such as temperature or price, it estimates how likely a categorical outcome is: spam or not spam, meltdown or no meltdown. A chosen probability threshold then turns that estimate into a label. section 8.0 section 8.2
For binary outcomes, the observed target is 0 or 1. Logistic regression fits an S-shaped sigmoid, or logistic, curve whose vertical axis is probability. As an input changes, the predicted probability can rise or fall but levels off toward 0% or 100%; this avoids the awkward straight-line fit that linear regression would give binary points. section 8.2
A practical workflow is:
- Recognize a classification problem: the desired result is a limited label, not a continuous number. section 8.0
- Fit the model to input values and binary outcomes; its coefficients define the S-curve. section 8.3
- Read the curve as a probability, then select a threshold when a yes-or-no prediction is needed; 0.5 is a common default. section 8.2
- Validate classification predictions with measures such as precision and recall rather than treating a label as automatic truth. section 8.0
Will a toddler melt down?
Use hours since a nap as the input and meltdown observed (0 = no, 1 = yes) as the outcome. The fitted curve suggests few meltdowns before roughly three hours, increasing likelihood afterward, and a probability near 1 by six hours. At 4.78 hours, the fitted example predicts a 0.9701 probability. Limiting observations to pre-nap hours can introduce bias, so interpret the result within that framing. section 8.2 section 8.3
Figure 8.2 A logistic regression model of time without a nap and whether a toddler had a meltdown
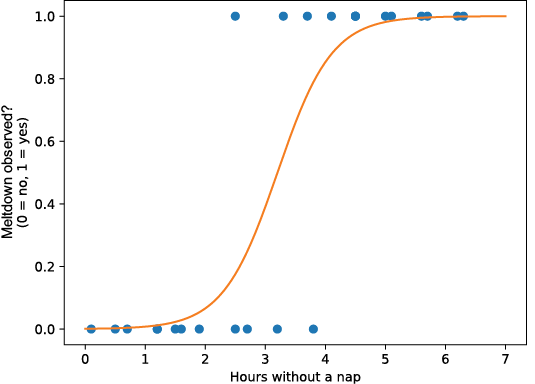
Inspect the binary observations and fitted S-curve together to see how probabilities replace a straight regression line. section 8.2
In Python, scikit-learn’s LogisticRegression can fit the data with fit(x, y). With one input variable, x is reshaped into a one-column array; coef_ and intercept_ supply the slope and intercept for the curve. For a new value, calculate the logistic formula directly or call predict_proba(). Regularization choices such as l1 and l2 are noted but left unexplored. section 8.3











