Slope measures a line’s steepness and direction. Calculate it as rise divided by run: how far the line moves up or down for each unit it moves right. In y = mx + b, m is the slope and b is the y-intercept. section 3.11 section 3.4
Read a slope this way:
- A slope of 0.5 means moving one unit right moves the line 0.5 units up. section 3.11
- A zero slope creates a horizontal line; a negative slope means the line falls as it moves right. section 3.11 section 3.4
- Increasing the slope rotates a line counterclockwise, while decreasing it rotates the line clockwise. section 3.11
- In a linear model, the slope is a feature’s weight: it estimates how much the predicted label changes when that feature increases by one unit. section 3.4
Housing prices
Suppose a housing model uses price = 100 + 50(number of rooms) + small error. The slope, 50, represents the estimated price increase for each additional room. A model with slope 51.05 and y-intercept 99.10 predicts $303.30 for a four-room house. section 3.4 section 3.18
Moving a fitted line
When a point lies above a line, adjust the line upward; depending on whether the point is left or right of the y-axis, rotate the line clockwise or counterclockwise as well. Tiny changes to slope and intercept move the line closer to the point. section 3.12
Figure 3.8 Some examples of slope and y-intercept. On the left, we see several lines with the same intercept and different slopes. Notice that the higher the slope, the steeper the line. On the right, we see several lines with the same slope and different y-intercepts. Notice that the higher the y-intercept, the higher the line is located.
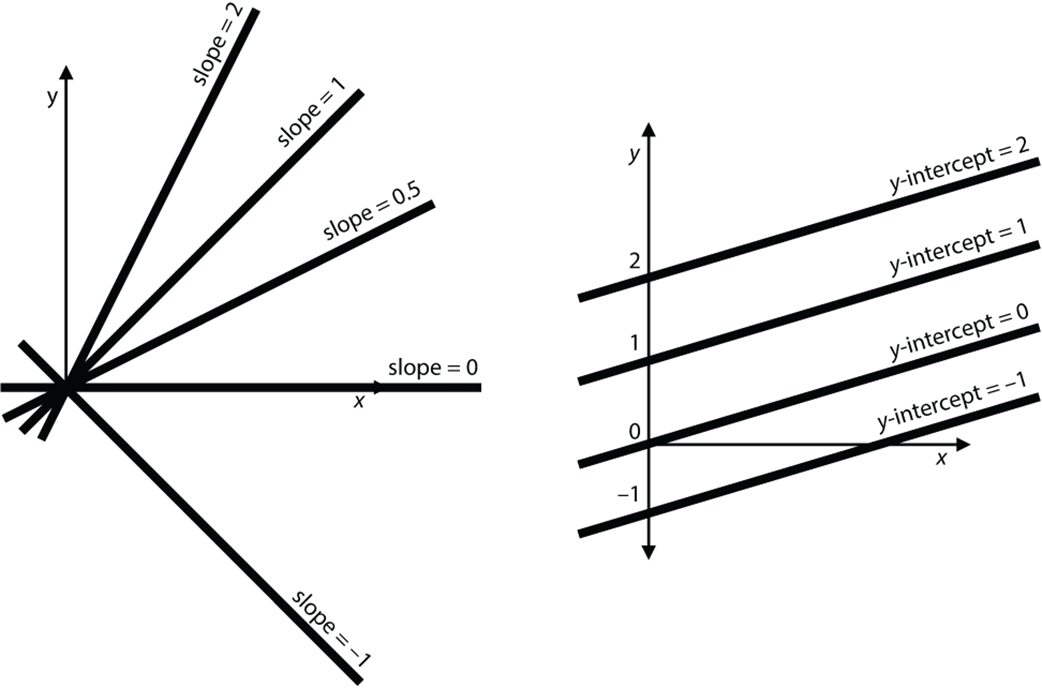
Compare lines sharing an intercept or sharing a slope to see how steepness and vertical position differ. section 3.11