A time series is a sequence of observations whose order matters. Measurements often arrive at regular intervals, such as daily stock prices or hourly electricity use. To understand a series, look beyond individual values: it may have cycles, trends, a usual regime, and sudden spikes. Forecasting uses the recent past to predict what comes next. section 13.1 section 13.0
For machine learning, one sample can be a sequence of feature vectors. A batch uses a rank-3 tensor shaped (samples, timesteps, features); by convention, time is the second axis. Unlike a batch of ordinary feature vectors, this representation keeps each sample’s ordered steps explicit. section 2.2.8
Figure 2.2 A rank-3 timeseries data tensor
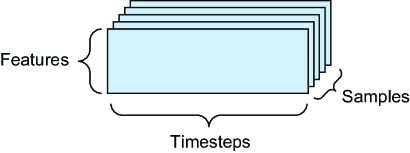
See how the sample, timestep, and feature axes fit together in a rank-3 time-series tensor. section 2.2.8
Weather measurements in order
The Jena weather dataset records 14 quantities, including temperature, pressure, and humidity, every 10 minutes. Each row is one timestep. Plotting temperature across 2009–2016 reveals a yearly cycle; plotting just the first 10 days makes a daily cycle easier to see. In R, after loading the data into full_df, the shorter view is: plot(`T (degC)` ~ `Date Time`, data = full_df[1:1440, ]). The observations are split into earlier training rows, then validation rows, then test rows. section 13.2
Order also affects model choice. In the temperature-forecasting example, flattening the input for a densely connected model removed its notion of time, while the tested convolutional approach lost order information through its treatment of segments and pooling. An LSTM, a kind of recurrent neural network, instead works with the input as a sequence and improved on those approaches. Forecasting is only one use: sequences can also support anomaly detection, classification, and event detection. section 13.3 section 13.1
Not every sequence is a time series. The broader idea is ordered data: a Transformer can process an image represented as a sequence of encoded patches alongside text tokens. What makes a time series distinctive is that its ordering follows measurements over time. section 16.4.2 section 13.1