Sequential data contains values whose order carries meaning. Displaying those values out of order can feel strange—or make the pattern meaningless—so preserve their natural progression. section 3.4.2
Common sequential data includes:
- Dates, such as the dates fruit was eaten. section 3.4.2
- Ordered positions or stages, such as sibling birth order, sales-funnel steps, pain-scale levels, and generations. section 3.4.2
- Survey responses with an inherent progression, including recommendation scores from 0 to 10 and Likert agreement scales. section 3.4.2
Sequential data may be discrete or continuous. Continuous dimensions are sequential by nature, while discrete dimensions can be sequential or categorical. That distinction helps determine whether reordering values would hide the story. section 3.4 section 3.4.2
Why sorting can backfire
Suppose a survey asks how likely people are to recommend a product, from 0 to 10. Sorting bars by length may make the chart tidy, but it obscures whether responses skew toward enthusiasm or disappointment. Keep the response scale in order instead. section 3.4.2
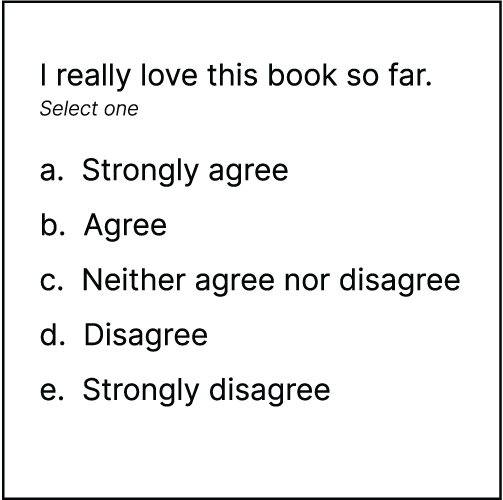
Use the Likert-scale survey figure to see how ordered response categories retain their meaning when displayed in sequence. section 3.4.2