liveBook · Manning

Sequence

As explained in Learn Docker in a Month of Lunches, Second Edition

A time series is an ordered sequence of values recorded with timestamps.

A time series is a set of metric values, each recorded with a timestamp. Prometheus can graph these values to show how a metric changes over time. section 9.3

Labels let you filter or aggregate metrics across containers. A simple PromQL query can sum matching values while ignoring selected labels. section 9.3

Aggregate request metrics

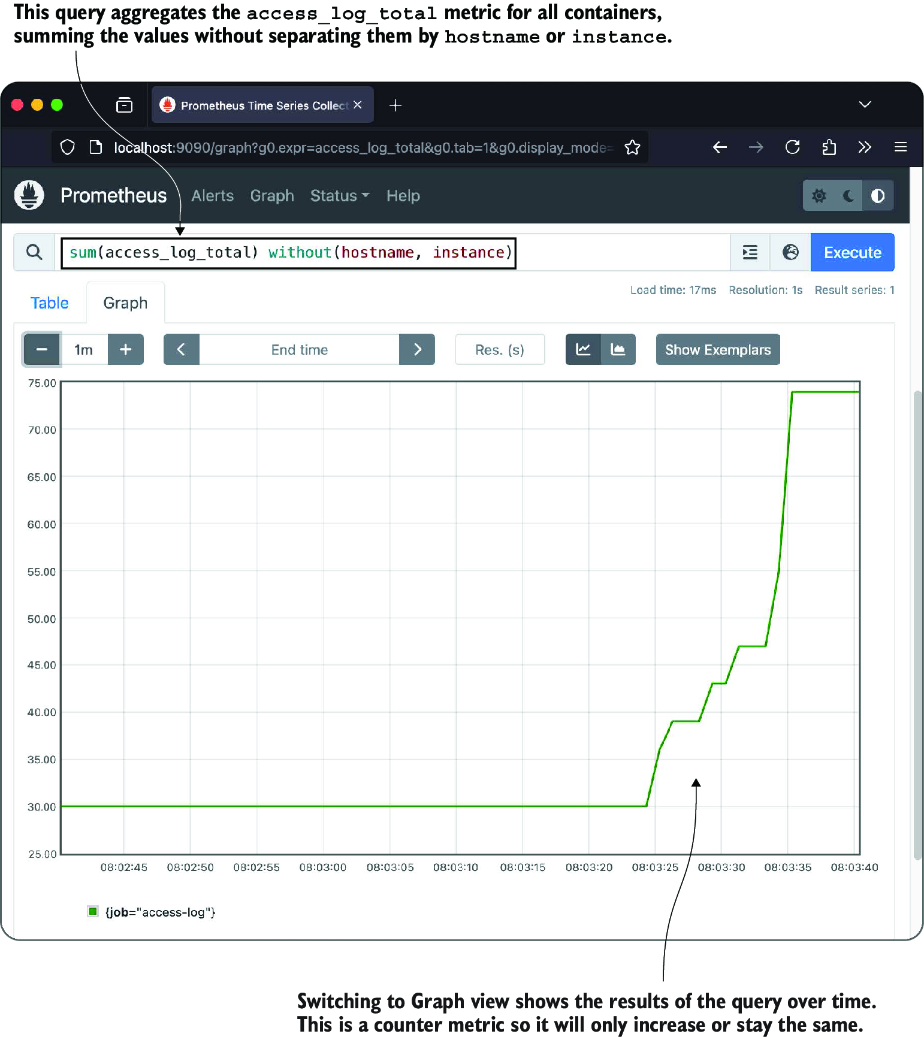
The query `sum(access_log_total) without(hostname, instance)` combines access-log counts across hosts and instances. section 9.3

Figure 9.9 Aggregating a metric to sum values from all containers and showing a graph of the results
figure

See an aggregated metric displayed as a graph over time. section 9.3

How Learn Docker in a Month of Lunches, Second Edition covers it

How deep it goes
Defines timestamped metrics and demonstrates graphing and aggregation, without developing time-series theory.
Examples
Shows a graph of aggregated access-log counts and a query that sums values across hosts and instances.
What you can do after
Apply it via PromQL to aggregate labeled metrics and graph changes over time.
How it connects
Connects time series to Prometheus labels, PromQL aggregation, and Grafana dashboards.

Also explained in

Compare how 22 books explain sequence →

Related concepts

This explainer was generated by Manning's knowledge graph from the text of Learn Docker in a Month of Lunches, Second Edition. The section links point to the parts of the book it draws on.