liveBook · Manning

Sequence

As explained in Just Use Postgres!

Time-series data consists of observations associated with timestamps or time intervals, often representing measurements or events over time.

Time-series data is a sequence of observations collected over time, with each point recording a system or object’s state at a specific moment. Comparing observations across a period reveals trends, supports proactive action, and enables predictions. section 9.0

Postgres can store and analyze time-series workloads through TimescaleDB, which provides specialized functions for processing large volumes of measurements while maintaining high performance. section 7.3 section 9.5

Typical applications include:

  • Tracking smartwatch heart-rate measurements to monitor health trends and trigger timely notifications. section 9.0 section 9.5
  • Reviewing server CPU and memory usage over the past week. section 9.0
  • Analyzing currency exchange-rate fluctuations or patient vital signs across longer periods. section 9.0
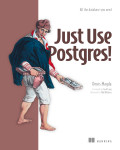
How Just Use Postgres! covers it

How deep it goes
Defines the data shape and surveys TimescaleDB analysis, specialized functions, aggregates, and indexing without detailing implementation.
Examples
Uses smartwatch heart rate, server resource usage, currency rates, and patient vital signs as examples.
What you can do after
Apply time-series storage and analysis in Postgres with TimescaleDB for monitoring and health-trend applications.
How it connects
Connects time-series data with Postgres, TimescaleDB, specialized functions, aggregates, B-tree indexes, and BRIN indexes.

Also explained in

Compare how 22 books explain sequence →

Related concepts

This explainer was generated by Manning's knowledge graph from the text of Just Use Postgres!. The section links point to the parts of the book it draws on.