Sequential data associates observations with timestamps or another ordering. In PostgreSQL monitoring, repeated statistics snapshots create time-series data that can be analyzed across changing system conditions. section 7.5
A practical PostgreSQL workflow turns sequential observations into usable operational evidence:
- Collect snapshots covering metrics such as cache hit ratio, connections, I/O, locks, wait events, WAL generation, and transactions. section 7.5
- Store the snapshots in database tables and resample them when thousands or millions of observations would be too numerous to plot directly. section 7.5
- Schedule regular collection with an operating-system or database scheduler, including pg_cron, so changes remain visible over time. section 7.5
Monitoring locks over time
pg_statviz can visualize the mean number and type of database locks from snapshots taken every minute over several months. This makes sequential lock observations easier to inspect as a trend rather than as isolated readings. section 7.5
Figure 7.1 pg_statviz locks analysis output. This visualization displays the mean number and type of locks in the database, with snapshots taken every minute over a period of several months in 2024.
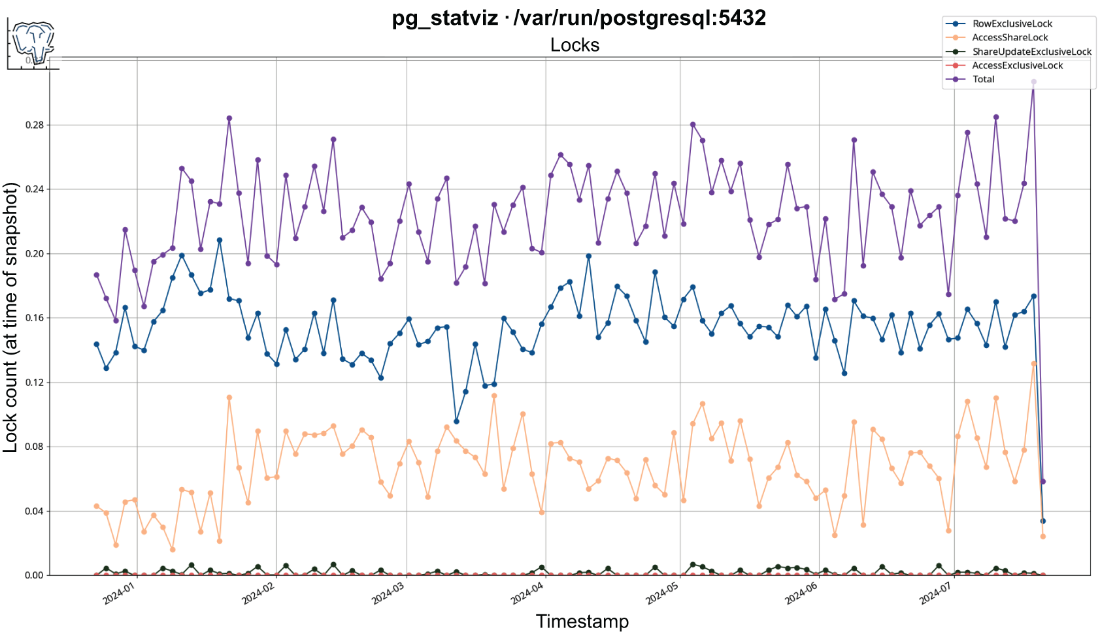
Use the locks-analysis visualization to inspect how lock counts and types change across a long sequence of timestamped snapshots. section 7.5