Transparency measures how easily people can understand a model's operation, predictions, and reliance on input features. It matters when selecting models for scientific and business data. section 3.0 section 3.5
Assess transparency through two practical questions:
- Explainability: can the model's behavior be explained intuitively to business stakeholders, regulators, or other nonspecialists? section 3.2 section 3.2.3
- Feature importance: can you determine which input features have the greatest effect on the model's behavior? section 3.2 section 3.2.3
House time on the market
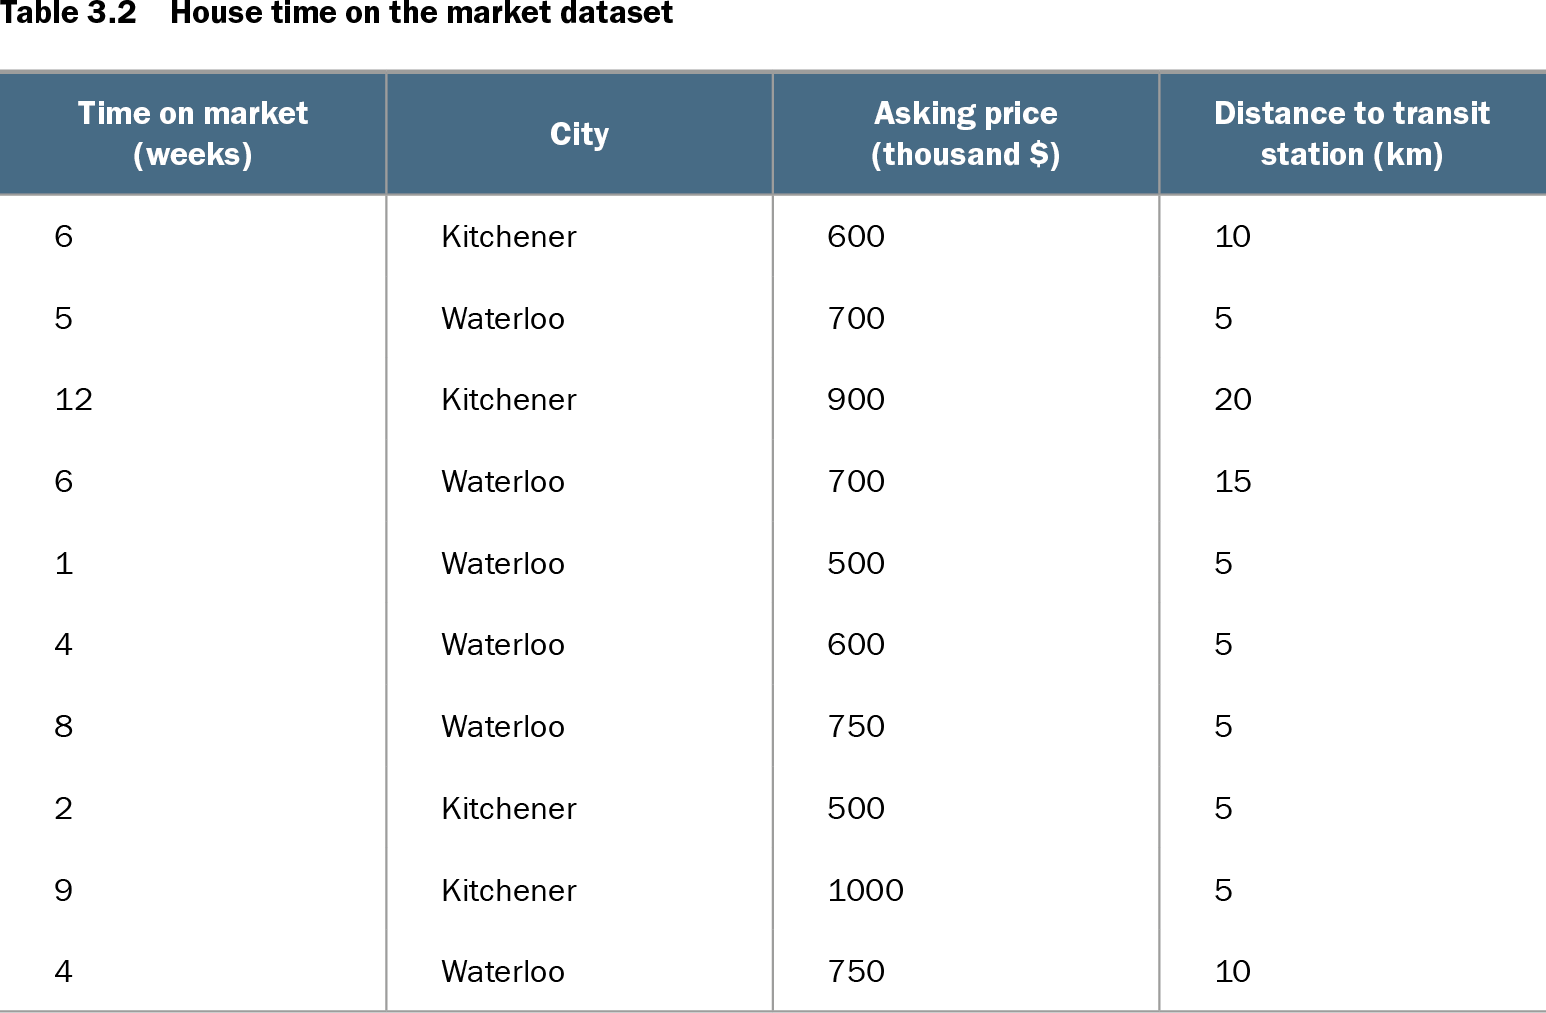
A model predicts whether a fresh listing will remain on the market for more or less than a month using city, asking price, transit distance, and historical time on market. This compact dataset makes explanations easier to inspect. section 3.2
Table 3.2 House time on the market dataset (view table figure)
| Time on market (weeks) |
City |
Asking price (thousand $) |
Distance to transit station (km) |
|---|---|---|---|
| 6 |
Kitchener |
600 |
10 |
| 5 |
Waterloo |
700 |
5 |
| 12 |
Kitchener |
900 |
20 |
| 6 |
Waterloo |
700 |
15 |
| 1 |
Waterloo |
500 |
5 |
| 4 |
Waterloo |
600 |
5 |
| 8 |
Waterloo |
750 |
5 |
| 2 |
Kitchener |
500 |
5 |
| 9 |
Kitchener |
1000 |
5 |
| 4 |
Waterloo |
750 |
10 |
Inspect the house listings table used to illustrate how model inputs relate to time on the market. section 3.2