Parallelism lets separate parts of a computation run at the same time. It can help when growing datasets strain an analytics workflow, but more workers do not guarantee a faster result. Hardware, budget, and the available technology stack constrain the choice. section 7.0 section 7.2.2
First decide what “faster” means. Execution time matters for a single calculation; concurrency measures how many queries or processes a system handles simultaneously without performance degradation. Measure the behavior you need rather than treating those two goals as interchangeable. section 7.1 section 7.2.2
When threads made bootstrapping slower
An optimized Python function estimates confidence intervals from bootstrap samples. An AI-assisted revision sends individual samples to a ThreadPoolExecutor. Despite a run using 16 threads, the parallelized version takes longer than the optimized one. Dividing work, starting workers, and queuing tasks carry costs; Python’s Global Interpreter Lock can also limit benefits for some workloads. Treat generated parallel code as a candidate to benchmark, not an automatic upgrade. section 7.2.2
import numpy as np
import pandas as pd
from concurrent.futures import ThreadPoolExecutor

def bootstrap_CI_parallelized(data, func, n_bootstraps=1000, ci=95,
axis=0):
    def single_bootstrap(idx):
        bootstrap_sample = data[idx]
        return func(bootstrap_sample, axis=axis)

    data = np.asarray(data)
    idx = np.random.randint(0, len(data), size=(n_bootstraps, len(data)))

    # Set the number of threads you want to use for parallelization
    num_threads = 4

    with ThreadPoolExecutor(max_workers=num_threads) as executor:
        bootstrapped_statistics = list(executor.map(single_bootstrap,
        idx))

    lower_bound = np.percentile(bootstrapped_statistics, (100 - ci) / 2)
    upper_bound =
    np.percentile(bootstrapped_statistics, 100 - (100 - ci) / 2)

    return lower_bound, upper_bound

# ... (calculate_ci_optimized function definition remains the same) ...
Compare the threaded bootstrap function with the optimized version: each sampled statistic becomes a task submitted through ThreadPoolExecutor. section 7.2.2
Figure 7.4 Dependence of the execution time of optimized (solid line) and parallelized (dashed line) bootstrapping functions on the size of the processed DataFrame
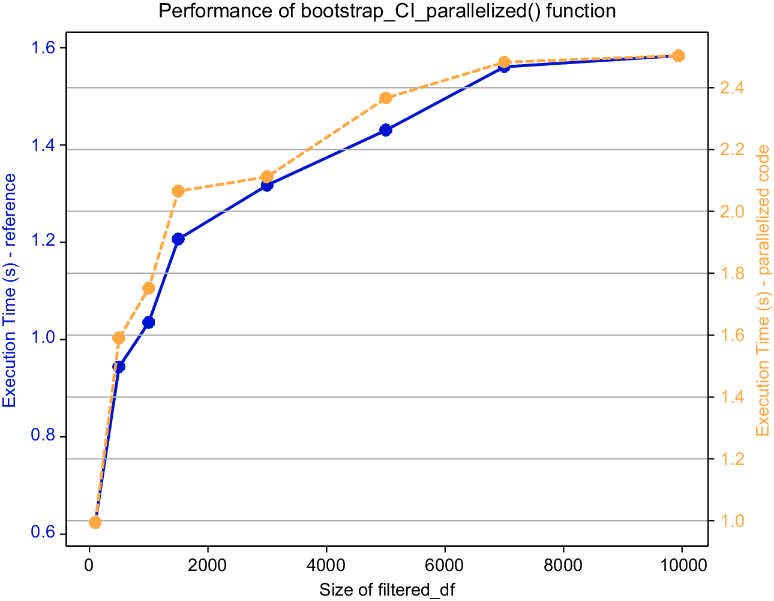
Inspect the execution-time comparison before deciding whether the extra workers helped. section 7.2.2
Choose work that separates cleanly. Distances between pairs of points are a better example: each pair can be calculated independently, with results gathered afterward. Across cluster nodes, synchronization and fault tolerance add complexity; established frameworks can handle those concerns. GPUs offer another parallel-computing option, but each approach still needs testing on the intended workload. section 7.3.1 section 7.2.2