A bar chart represents quantitative values with bars whose lengths or heights support comparisons across categories. Grouped or stacked bars can summarize organizational metrics, but chart choice should follow the analysis and stakeholder question. section 7.3.2
Use bar charts carefully when communicating metrics:
- Prefer simpler grouped or stacked bars when stakeholders need an easily interpretable summary. section 7.3.2
- Avoid using bars to show segmented trends over time when lines make growth trajectories easier to follow. section 7.3.2
- Check the y-axis because truncation or unsuitable limits can exaggerate or minimize apparent fluctuations. section 7.3.2
Figure 7.22 Line graphs are typically easier to interpret when visualizing trends between groups over time.
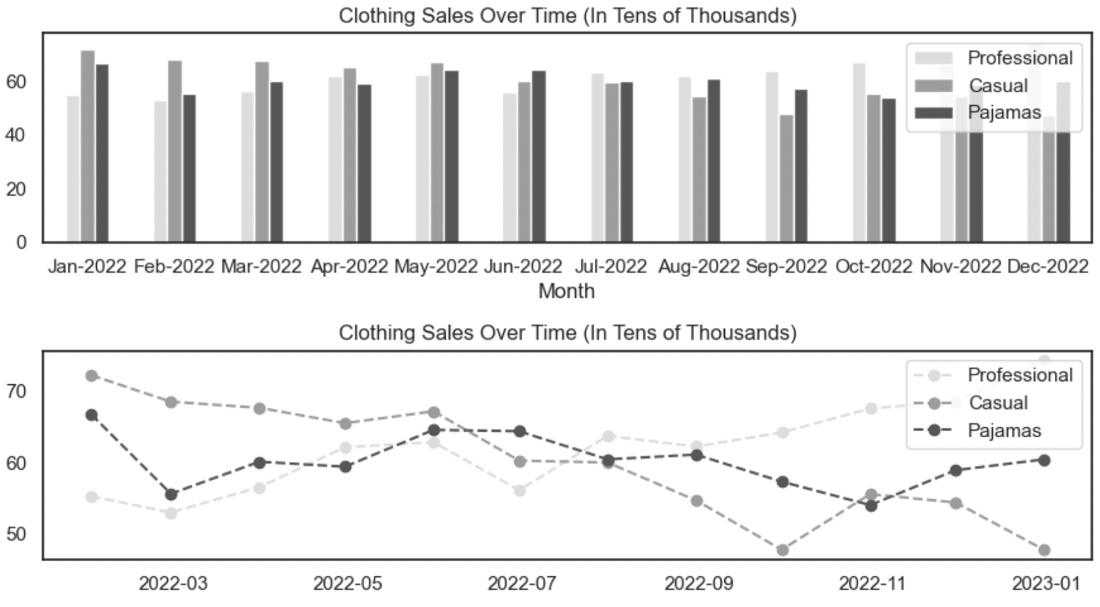
Compare how line graphs can communicate trends between groups over time more clearly than grouped or stacked bars. section 7.3.2