Suppose you need to estimate customers’ average monthly spending, but surveying everyone is impractical. A random sample of 100 customers averages $200. That number is a starting point, not necessarily the average for all customers. A confidence interval expresses the uncertainty in estimating the population average from a sample. section 3.4.1
A range instead of a single number
Imagine the 95% confidence interval for average monthly spending is $180–$220. The interval gives a more useful basis for planning than $200 alone: the sample does not pinpoint the population average. The 95% level describes the interval-making procedure—across repeated samples, about 95 in 100 intervals would contain the true average—not a guarantee that this particular interval does. section 3.4.1
Before calculating an interval, ask what needs estimating. If you have every transaction for the period and population of interest, calculate its average directly. If you have only a subset, or rely on a survey, an estimate has uncertainty. Interval width depends on sample size, the chosen confidence level, and variability in the data. section 4.8
Ask for code, then inspect it
A useful AI request is: “Using order-item and product records, examine how product weight and volume relate to freight value. Show the data preparation, fit the regressions, and plot 95% confidence intervals. Explain what each interval describes.” Inspect the generated workflow before trusting its plot: check the product-ID merge, volume calculation, selected columns, and treatment of missing rows. Then run it and compare the plotted relationships with the underlying records. section 3.4.1 section 3.4.2
# Function to plot regression line with confidence interval
def plot_regression_with_ci(X, y, model, xlabel, ylabel):
    fig, ax = plt.subplots()
    sns.regplot(x=X.iloc[:, 1], y=y, ax=ax, scatter_kws={'alpha': 0.3})
    st, data, ss2 = summary_table(model, alpha=0.05)
    predicted = data[:, 2]
    upper = data[:, 4]
    lower = data[:, 5]
    ax.plot(X.iloc[:, 1], predicted, '-', lw=2, color='red',
    label='Fitted Line')
    ax.fill_between(X.iloc[:, 1], lower, upper, color='red', alpha=0.15,
    label='95% CI')
    ax.set_xlabel(xlabel)
    ax.set_ylabel(ylabel)
    ax.legend()
    plt.show()

# Plot the relationship between weight and freight value
plot_regression_with_ci(X_weight, y, model_weight,
xlabel="Product Weight (g)", ylabel="Freight Value")

# Plot the relationship between volume and freight value
plot_regression_with_ci(X_volume, y, model_volume,
xlabel="Product Volume (cm³)", ylabel="Freight Value")
The plotting function obtains fitted values and interval bounds from a regression summary table with alpha=0.05, then draws a shaded 95% confidence band. Check which fitted model and variables are passed to it. section 3.4.2
Figure 4.6 Confidence intervals for (a) average sales price and (b) average review scores, for transactions in the “health and beauty” category of products
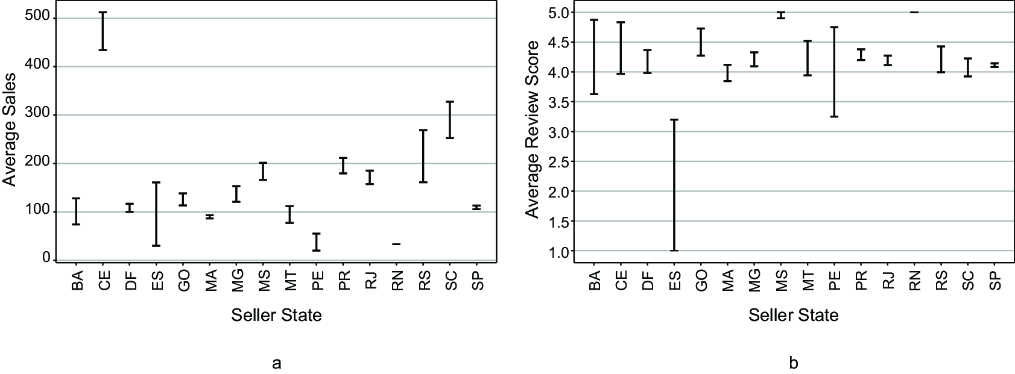
The figure places intervals for average sales prices and review scores side by side. Use the ranges, not just their central estimates, when judging differences between groups. section 4.8
Intervals can also restrain a tempting conclusion. When customer-satisfaction results for two states leave too much uncertainty, do not declare one state the winner from their point estimates. Some results may still warrant attention; others call for more evidence. An interval communicates uncertainty, but it cannot repair an unsuitable sample or an unchecked analysis. section 4.8 section 3.4.1









