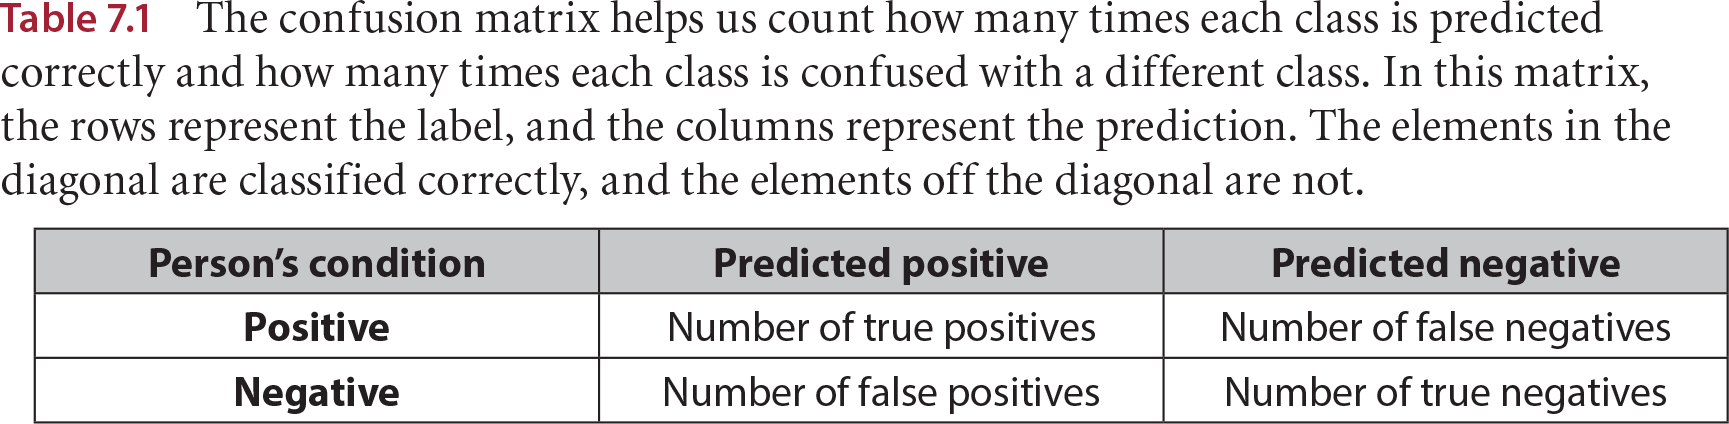
A confusion matrix counts how often a classifier predicts each class correctly or mistakes it for another. For binary classification, its rows show the true labels and its columns show the predicted labels. section 7.2
For two classes, the four counts are:
- True positive: a positive case predicted positive; true negative: a negative case predicted negative. section 7.2
- False positive: a negative case predicted positive; false negative: a positive case predicted negative. section 7.2
Table 7.1 The confusion matrix helps us count how many times each class is predicted correctly and how many times each class is confused with a different class. In this matrix, the rows represent the label, and the columns represent the prediction. The elements in the diagonal are classified correctly, and the elements off the diagonal are not. (view table figure)
| Person’s condition |
Predicted positive |
Predicted negative |
| Positive |
Number of true positives |
Number of false negatives |
| Negative |
Number of false positives |
Number of true negatives |
Read across each row to compare a true class with the predicted classes. Correct predictions lie on the diagonal; misclassifications lie off it. section 7.2
A medical diagnosis
If a model labels every patient healthy, it can make few errors overall yet miss every sick patient. Its matrix shows 10 false negatives and zero false positives, making the error pattern visible. section 7.2