A confusion matrix is a table that compares predicted classes with actual classes. It separates correct predictions from the two ways a classification can be wrong. section 8.8
Read the four cells as follows:
- True positive (TP): the system predicts the positive class, and the case is actually positive. section 8.8
- False positive (FP): the system predicts the positive class, but the case is actually negative. section 8.8
- True negative (TN): the system predicts the negative class, and the case is actually negative. section 8.8
- False negative (FN): the system predicts the negative class, but the case is actually positive. section 8.8
The wolf alarm that scores 98%
Imagine an alarm tested across 100 days. It misses one wolf and falsely reports another, while producing 98 true negatives. Accuracy looks impressive, but the zero true positives reveal that it detected no actual wolves. Predicting “no wolf” every day would even reach 99% accuracy. section 8.8
The desirable pattern places counts on the top-left to bottom-right diagonal: true positives and true negatives high, false positives and false negatives near zero. When positive cases are uncommon, class imbalance can make accuracy look strong while hiding poor detection. section 8.8 section 8.9
The matrix also supports precision and recall. Precision asks how often positive predictions are correct; recall asks how many actual positive cases are found. Raising the alarm threshold may improve precision while reducing recall. section 8.9
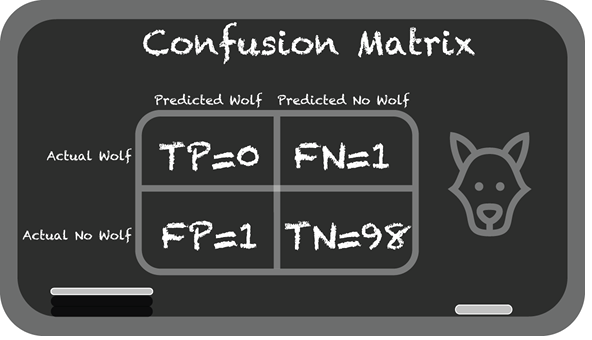
Inspect the confusion-matrix figure to see actual classes arranged against predicted classes and locate correct versus incorrect outcomes. section 8.8













