liveBook · Manning

Dimensionality reduction

As explained in Delivering Machine Learning Projects: From design to deployment

Dimensionality reduction is the transformation of data into fewer dimensions while attempting to preserve informative structure.

Dimensionality reduction transforms high-dimensional embeddings into fewer dimensions so teams can visualize distribution and inspect structure indirectly. PCA and t-SNE can help, but may lose substantial information. section 6.1.4

Use it as an exploratory work item:

  • Generate embeddings for unstructured items with a suitable foundational model. section 6.1.4
  • Apply PCA or t-SNE to visualize the embedding distribution, then record what the projection reveals and what information it may discard. section 6.1.4
  • For richer exploration, index embeddings with FAISS or Annoy and query nearest neighbors instead of relying only on a projection. section 6.1.4

Shakespeare play exploration

Split plays into sentences, embed them with all-MiniLM-L12-v2, index them with FAISS, and visualize nearest-neighbor links as a heatmap. The resulting relationships can suggest similarities or distances between plays, but still require interpretation. section 6.1.4

Figure 6.4 Heat map of nearest neighbor connections in Shakespeare’s plays using all-MiniLM-L12-v2
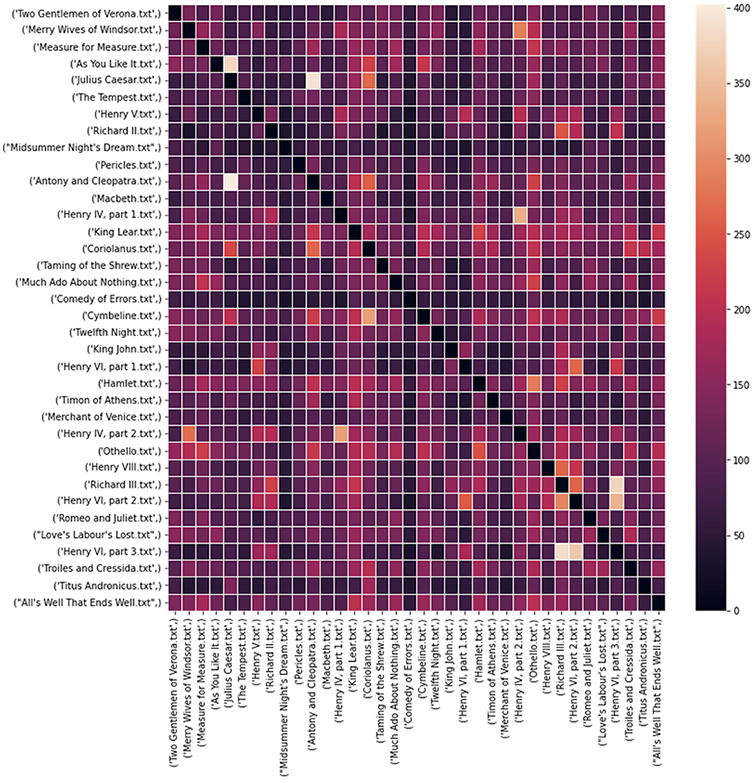
Use the heatmap to inspect nearest-neighbor connections among Shakespeare’s plays. section 6.1.4


How Delivering Machine Learning Projects: From design to deployment covers it

How deep it goes
Explains the visualization workflow and information-loss risk, but does not develop the underlying algorithms mathematically.
Examples
Uses embedded Shakespeare sentences, FAISS neighbor queries, and heatmaps comparing plays.
What it assumes
Assumes access to generated embeddings and teaches how to inspect them indirectly rather than consume their coordinates directly.
What you can do after
Evaluate unstructured-data structure by projecting embeddings or querying their nearest neighbors.
How it connects
Connects embeddings with PCA, t-SNE, vector indexing, nearest-neighbor search, and heatmaps.

Also explained in

Compare how 11 books explain dimensionality reduction →

Related concepts

This explainer was generated by Manning's knowledge graph from the text of Delivering Machine Learning Projects: From design to deployment. The section links point to the parts of the book it draws on.







