Dimensionality reduction represents data using fewer dimensions while retaining information useful for the task. In outlier detection, it can make many-feature datasets faster to assess and sometimes improve detection. It can also make two- or three-dimensional visualization possible. The choice of what to retain matters: a compact representation is not automatically a good representation for finding outliers. section 10.1.1
Distance-based detectors can struggle as features accumulate. Differences that stand out in one feature may be swamped by distances across many others, leaving records roughly equidistant. Many features can also slow fitting or prediction and create apparently unusual values by chance. Reducing dimensions is one response; training separate detectors on feature subspaces is another. section 3.1.3 section 10.1
Principal component analysis (PCA) transforms correlated features into components. The first components capture more variance; later ones capture what remains. For points clustered along a diagonal in two-dimensional space, one component follows that pattern and the other runs across it. A point can therefore stand out either by being extreme along the pattern or by departing from it. Transforming data into the same number of components changes coordinates; selecting fewer components performs dimensionality reduction. section 6.9 section 10.1.1
A practical comparison should check detection as well as speed:
- Fit the same detectors on original features, all PCA components, and selected component subsets; compare fit and prediction times. section 10.1.1
- Compare outlier scores or ranks for cases of interest. Do not retain only the highest-variance components by habit: later components may expose departures from feature relationships. section 6.9 section 10.1.1
- Inspect whether the transformed view helps explain a flagged point. Separation in component space need not make the components themselves easy to interpret. section 10.1.1
Compare correlated and independent features
One test uses 100,000 rows and ten associated features, with a record that breaks their usual relationships. Another uses ten unassociated features, with a record made extreme in several. Six PyOD detectors are tested on the original data and PCA variations. In the correlated test, reducing to three components cuts LOF fit time from 19.4 to 1.4 and prediction time from 20.8 to 1.4 in the reported runs; not every detector gains equally. The known outlier ranks first for all six detectors when the last three components are used, illustrating why detection quality must be checked alongside runtime. section 10.1.1
Figure 10.1 Scatterplot of the last two components of the PCA transformation of the first dataset, which contained an unusual combination of values. Here we see a single point in the top-right of the space. It is clear that the point is a strong outlier, though it is not clear what components 8 and 9 represent.
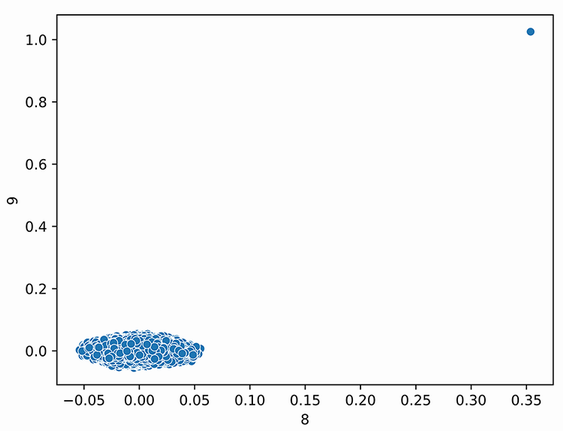
The last two PCA components isolate a record with an unusual combination of values, while showing the difficulty of interpreting what those components represent. section 10.1.1
PCA is one option alongside t-SNE, UMAP, and auto-encoders. Different component selections can also supply varied views to an ensemble of outlier detectors. Choose the representation against the outliers sought, the detector’s runtime, and the need to explain results rather than treating one reduction as universally best. section 10.1.1 section 14.3.2










