A missing value is an expected observation that is absent. In a visualization, the important part is not to quietly smooth it away: an unseen gap can make people infer a trend or continuity that the data does not support. section 9.1.1
Missingness can appear at two scales. A series may have an occasional hole, such as a day with no recorded value. Or it may be sparse because collection has only just begun, leaving more gaps than observations. Both deserve an honest visual treatment, even if the result is less tidy. section 9.1.1
Make gaps legible rather than accidental-looking:
- In a line chart, mark observed points with dots so viewers can distinguish actual values from the connecting stroke. section 9.1.1
- Break a line where data is missing; a continuous line otherwise implies a connection across the gap. section 9.1.1
- In a time-based bar chart, retain empty positions for missing days, weeks, or months instead of closing ranks around them. section 9.1.1
- If point markers make a chart too busy, reconsider the chart, reduce the displayed data, or make the markers smaller rather than concealing the gaps. section 9.1.1
- When data is still arriving, allow room for the display to grow rather than optimizing only for its thin early state; this anticipatory planning is future-proofing. section 9.1.1
A daily series with a hole
Suppose a daily line has values on Monday, Tuesday, Thursday, and Friday, but none on Wednesday. Dots identify the four observations, and a break between Tuesday and Thursday makes Wednesday’s absence visible. A daily bar chart should likewise leave Wednesday’s slot empty. The gap is information, not a formatting defect. section 9.1.1
Figure 9.1 When trending data in a line chart, I like to make it more obvious where the data points are by adding a dot at each point. Not only is it easier to understand, but it’s also more apparent when there’s data missing. Breaking the line on missing data points further drives the point home.
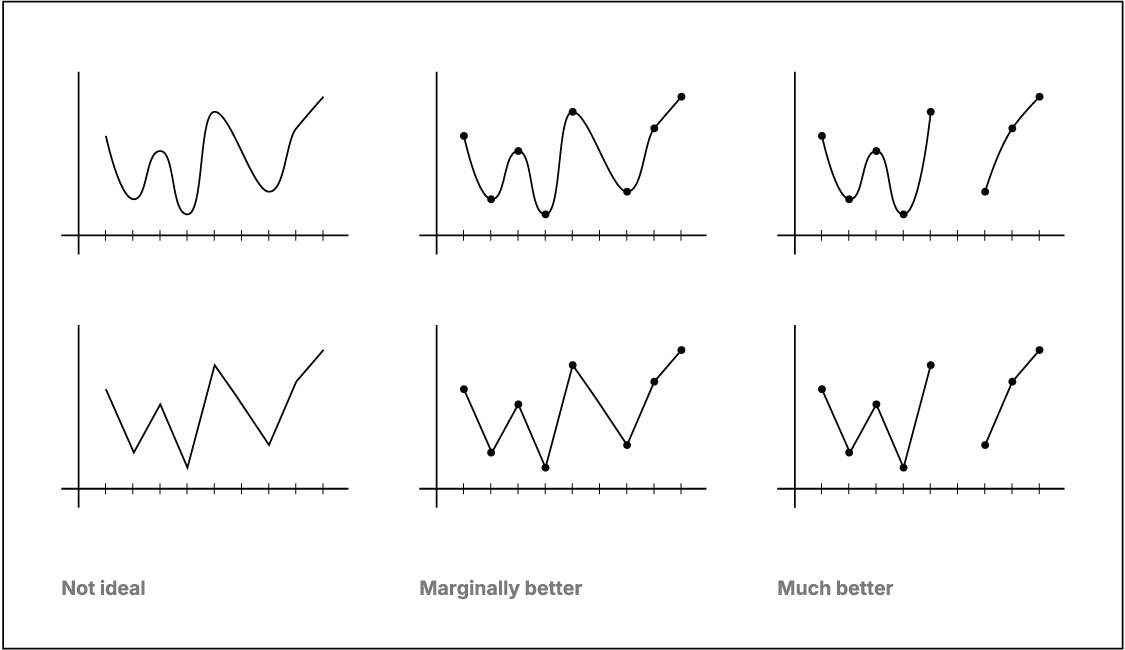
Point markers and a broken segment make both the observed values and the missing interval easy to see at a glance. section 9.1.1
A null is related but not identical language: in JSON, null represents nothing, an unassigned value, or an empty value. Whether it should be treated as a missing observation depends on what that field and row are meant to represent. section 3.5.2 section 3.6