Observability infers an agentic system’s internal behavior from emitted traces, metrics, and structured logs, making failures and improvement opportunities visible. section 8.3.6
A practical observability setup tracks three complementary views:
- Traces follow each turn and tool call across UI, gateway, agent, tools, and model, using correlation identifiers such as session_id and tool_call_id. section 8.3.6
- Metrics reveal whether the system runs well and delivers value: latency, tool success, tokens, cost, grounding, evaluator scores, task completion, and escalation. section 8.3.6
- Structured logs capture payloads and interactions that traces may miss; redact personally identifiable information before retaining them. section 8.3.6
Add searchable trace context
Register a Phoenix project, associate session, user, and intent metadata with a turn, then inspect the resulting trace and filter activity by those attributes. section 8.3.6
Figure 7.6 Arize Phoenix deployment patterns and use cases for tracing, tracking, and evaluating agents
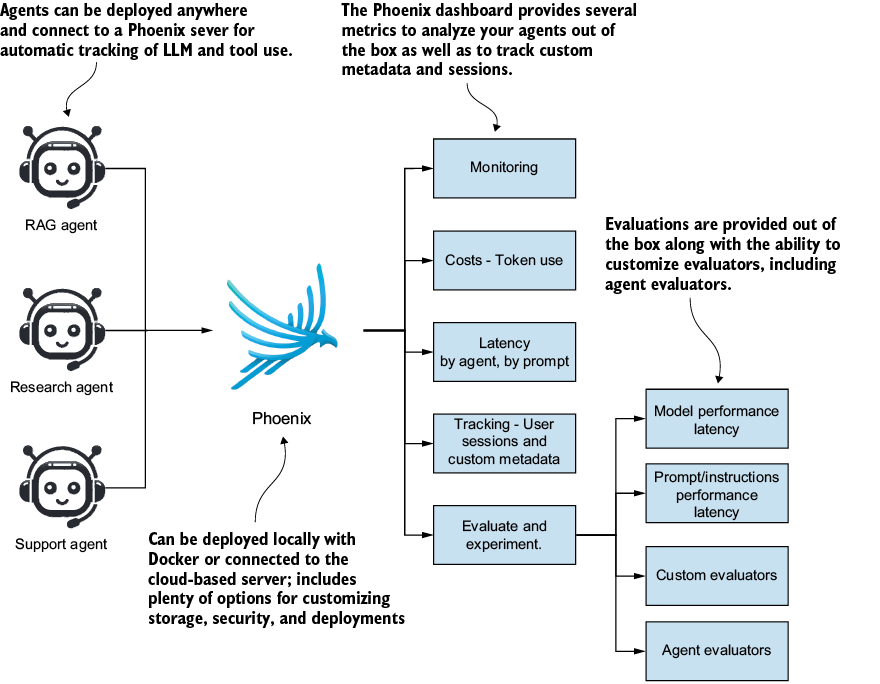
Use the deployment overview to compare how Phoenix supports tracing, usage tracking, and agent evaluation. section 7.4