Observability is the ability to determine and explain a software system’s internal state and usefulness from its output data. It helps teams detect, diagnose, and fix problems, but its value extends beyond troubleshooting: shared evidence can show whether a platform is improving delivery and serving its users. section 5.1 section 3.6
Monitoring answers questions about known conditions through checks and alerts. Observability must also help investigate unexpected behavior. Metrics, logs, and traces are inputs, not the insight itself; tracing and transaction IDs help connect events across services, while flexible time-series views support questions that were not anticipated when dashboards were built. section 5.5
When application monitoring is not enough
Suppose an engineering team can troubleshoot application performance, yet customers still report poor experiences. Failed overnight tasks, disks that fill before anyone acts, delayed conversion figures, and cloud-cost reports that arrive too late all leave important questions unanswered. Expanding observability means identifying who needs answers—not only developers and operators, but also security, finance, and business stakeholders—and making relevant data available in time to act. section 5.1.2
Treat observability as part of each platform feature’s definition of done. Both healthy and unhealthy behavior should be visible from the start, rather than instrumented after an incident. A self-service platform should likewise make workloads observable by default, so developers can investigate their own changes without waiting for a specialist to assemble a report. section 2.4 section 5.5
Build the capability incrementally:
- Define the questions and goals first, including system health and the outcomes stakeholders need to assess. section 5.5 section 3.6
- Choose or build a framework with a predictable user experience; instrument code and verify automated collection from the required sources. section 5.5
- Aggregate telemetry across services instead of giving each team an isolated view. Integrate access with single sign-on and role-based permissions so users can reach the shared view without extra friction. section 5.2.1
- Establish shared responsibility for the data and service. Use service level objectives to communicate reliability and build user confidence. section 5.5
A shared service also needs operational independence. If dashboards and alerts run only inside the Kubernetes cluster they observe, a cluster or ingress failure may hide the outage. Keep collection close to workloads where needed, but place broader observability components on dedicated infrastructure and use external monitoring for the platform and observability service themselves. section 5.3.3
Figure 5.10 Observing your engineering platform should be done external to the platform itself. Otherwise, you risk not being alerted properly about a total outage because the observability system would also be down. Similarly, your observability platform is an equally critical system component and should also be observed externally.
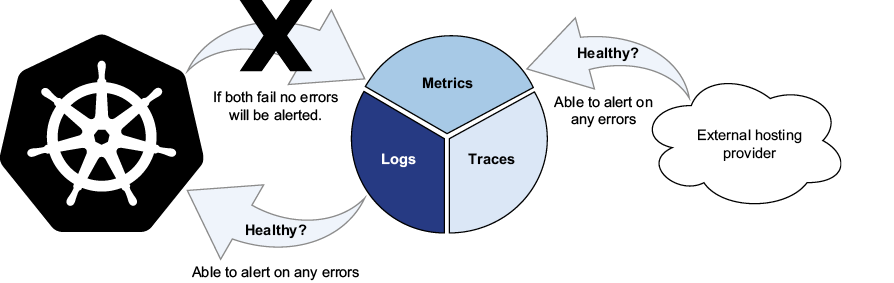
The diagram makes the outage dependency visible: a platform and its observability service need monitoring that remains reachable when either fails. section 5.3.3
Avoid turning useful data into a collection of fragile, independently maintained spreadsheets and dashboards. When every data-structure change breaks someone’s report, developers inherit support work and delivery slows. A coherent, accessible observability service lets teams ask new questions while keeping attention on reliability, developer autonomy, and measurable value. Evolve it as needs grow; a complete platform is not a prerequisite for making each new capability observable. section 5.0 section 5.1 section 5.5