Observability is the practice of exposing and analyzing detailed telemetry to understand a system's internal behavior from its external outputs.
Observability exposes rich telemetry from a distributed application and helps teams understand internal behavior through external outputs. It goes beyond aggregated logging and monitoring by making microservice interactions queryable and visible. section 11.2.7section 11.2
Use observability to:
Investigate failures by asking targeted questions, such as whether a problem affects a particular user or region. section 11.2.7
Correlate requests and messages across microservices to locate the service causing an error. section 11.2.7
Support ongoing monitoring, triage, debugging, and reliability work after deployment. section 11.0section 11.6
Tracing a multi-service failure
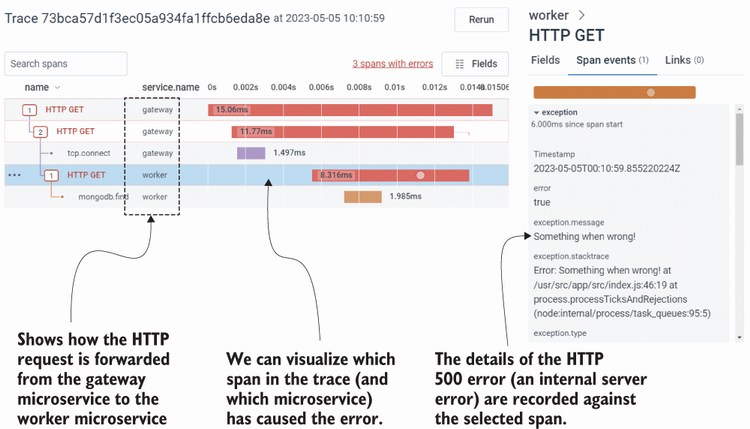
An example trace in Honeycomb follows a request through multiple microservices and helps pinpoint the error. Engineers can drill into the telemetry instead of relying only on aggregated logs. section 11.2.7
Figure 11.8 An example trace (shown in Honeycomb) that allows us to pinpoint an error in a multi-microservice request
Inspect the example trace showing how a multi-microservice request can reveal the location of an error. section 11.2.7
How Bootstrapping Microservices, Second Edition: With Docker, Kubernetes, GitHub Actions, and Terraform covers it
How deep it goes
Defines telemetry, querying, visualization, and correlation, but stops short of implementation code.
Examples
Uses Honeycomb traces and questions about users, regions, requests, messages, and error locations.
What it assumes
Assumes familiarity with distributed applications and microservices while introducing telemetry-based investigation practices.
What you can do after
Diagnose/debug distributed failures by querying telemetry, correlating service interactions, and locating problematic microservices.
How it connects
Connects observability with logging, monitoring, OpenTelemetry, distributed tracing, microservices, debugging, and fault tolerance.
Effective Platform EngineeringObservability is the ability to determine and explain a software system’s internal state and usefulness from its output data.
Grokking AI ApplicationsThe capability to understand an application's internal behavior from its outputs, telemetry, logs, traces, and related runtime signals.
Cloud Observability in ActionObservability is the capability to infer and continuously discover a system’s internal state from externally available signals in order to influence that system.
Architecting an Apache Iceberg LakehouseObservability is the capability to infer a system's internal behavior and resource usage from its emitted telemetry and operational data.
Generative AI in ActionObservability is the practice of monitoring, logging, and tracing a system to understand its internal behavior and diagnose problems from its outputs and operational data.
Machine Learning Platform EngineeringObservability is the ability to infer the internal state and behavior of a deployed system from its outputs and telemetry, including application-specific information flows.
Automating API DeliveryObservability is the ability to query and analyze instrumented system behavior to determine the causes of previously unanticipated problems.
Troubleshooting Java, Second EditionObservability is the ability to infer a system's internal behavior from its emitted telemetry and other external outputs.
AI Agents in Action, Second EditionObservability is the practice of inferring and diagnosing a software system's internal state from its externally emitted telemetry.
Logs and TelemetryObservability is the ability to understand a system's internal state from externally emitted telemetry such as logs, metrics, and traces.
Digital Twins in ActionObservability is the ability to understand a system's internal condition and behavior from its externally generated outputs and operational signals.
Google Anthos in ActionObservability is the ability to understand a system's internal state from the outputs it produces, such as metrics, logs, and traces.
AI Agents in ActionObservability is the collection and analysis of execution signals that reveal an agent system's behavior, performance, and failures.
trajectoryhas part · A trajectory is an ordered sequence of states, actions, events, or operations that records or describes progression through successive steps or over time.
monitoringhas part · Monitoring is the ongoing observation and measurement of a system’s behavior, state, or operational signals to assess its condition and detect changes or problems.
telemetryuses · Telemetry is automatically generated or collected operational data describing a system’s activity, state, behavior, or performance.
OpenTelemetryimplemented by · OpenTelemetry is an open, vendor-neutral observability standard and framework for instrumenting software and generating, collecting, and exporting telemetry such as traces, metrics, and logs.
performanceuses · Performance is the measurable effectiveness or operational behavior of a system under specified conditions, assessed through relevant qualities such as task results, speed, responsiveness, throughput, or resource use.
metricuses · A metric is a quantitative measure used to characterize or assess a property, condition, behavior, performance, or outcome.
This explainer was generated by Manning's knowledge graph from the text of Bootstrapping Microservices, Second Edition: With Docker, Kubernetes, GitHub Actions, and Terraform. The section links point to the parts of the book it draws on.