Observability infers internal system behavior from telemetry and other external outputs. In distributed systems, it makes request flow, failures, performance, and service health easier to investigate. section 12.1.2 section 12.3.3
A practical observability setup follows a short chain:
- Generate telemetry with OpenTelemetry, either by writing instrumentation that creates spans or by attaching the OpenTelemetry Java agent at startup. section 12.1.2
- Capture common framework activity automatically, including Spring, gRPC, JDBC, and HTTP client operations. section 12.1.2
- Export spans through protocols such as OTLP or gRPC to Jaeger or Zipkin, then search and inspect traces in their web interfaces. section 12.1.2
- Combine distributed traces with structured logs, service metrics, and schema validation instead of treating one tool as the complete diagnosis. section 12.3.3
Finding a timeout mismatch
A trace shows the frontend calling OrderService for 2,000 milliseconds while the downstream operation completes in 3,000 milliseconds. The checkout request fails even though the order service works correctly. Comparing trace durations with P95 and P99 latency helps reveal that the configured timeout is too short for some requests. section 12.3.3
Figure 12.3 OpenTelemetry collects relevant data from the running service. Jaeger and Zipkin are tools that aggregate and display nicely this data to help you easily troubleshoot the system.
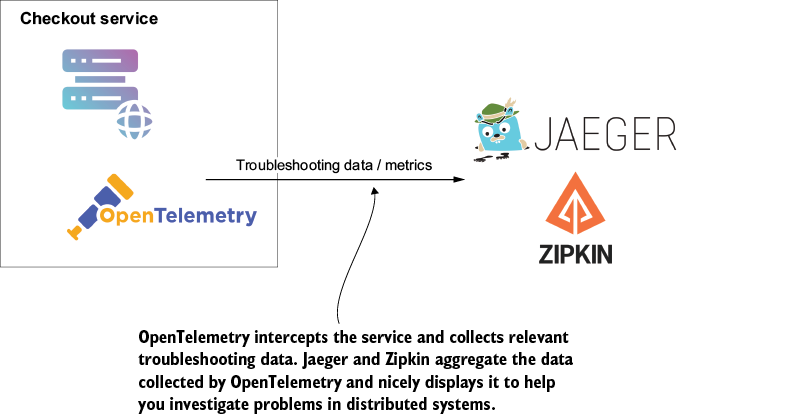
Use the architecture diagram to connect a running service, OpenTelemetry collection, and Jaeger or Zipkin trace visualization. section 12.1.2