A graph can have several valid drawings, but some have fewer edge crossings than others. For a non-planar graph, finding a drawing with the minimum possible number of crossings is NP-hard. Optimization offers a practical alternative: define what makes a solution better, then search for a good one without examining every possible drawing. section 16.0 section 18.1
Turn the problem into a search before choosing an algorithm:
- Represent each candidate solution. A graph drawing can be specified by its vertices’ coordinates; a traveling-salesperson route can be encoded as a permutation of vertices. section 16.2 section 18.2.1
- Choose an objective. The number of crossings is one possible cost for a drawing; total route distance is a cost for a traveling-salesperson route. Minimize cost, or express a maximization goal through a suitable fitness function. section 16.2.1 section 18.2.1
- Decide how to explore candidates. Random sampling tests independent solutions; local search instead changes a current solution and looks for improvement. section 16.2.3 section 18.1
The objective’s shape matters. Crossing count can remain unchanged across many vertex positions, then jump abruptly. That makes it a poor fit for gradient descent, which uses the gradient of a differentiable cost function to move downhill. A downhill search can also stop at a local minimum rather than the global minimum. Simulated annealing sometimes accepts uphill moves to search beyond such traps; genetic algorithms explore with a population of solutions. section 16.2.1 section 18.1 section 16.6
Figure 16.7 The cost function for “number of intersections” for a specific embedding of K4. The position of 3 out of 4 vertices is locked, and for the last one, v4 in the graphic, we can only change its horizontal position. Under these assumptions, the cost as a function of v4’s x position is a discontinuous function, equal to 0 when 0 < x < 25, and equal to 1 when x < 0 or x > 25. Notice how at x==0 and x==25 we have two discontinuity points, and in particular, we assume the cost is infinite at those points, because the vertex is exactly lying on one of the edges between the other vertices.
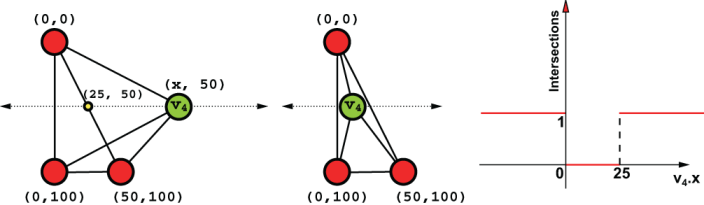
With three vertices fixed and the fourth moving horizontally, crossing cost jumps between zero and one. The picture makes clear why this objective does not provide a smooth downhill direction. section 16.2.1
Compare methods under the same search budget and account for the cost of each attempt. In one 500-iteration K8 comparison, random sampling found a drawing with 27 crossings while simulated annealing found one with 19. But evaluating crossings and cloning whole drawings can be expensive. Keeping only a changed vertex and updating its contribution may reduce that work; a simpler implementation can be preferable while establishing whether the search strategy works. No fixed time or space bound follows from the word “optimization”: the number of attempts, solution representation, and cost evaluation all matter. section 17.3.1 section 16.2.3