Suppose you need to draw a graph with as few crossing edges as possible. Before searching for a better drawing, you need a way to score each candidate. An objective function—called a cost function when lower is better—assigns that score. The optimization algorithm searches for a candidate with low cost; the function defines what “better” means. section 16.2.1 section 16.6
In supervised learning, a cost function is usually called a loss function. It measures the discrepancy between model predictions and observed targets. For linear regression, a common choice sums squared vertical distances between data points and a model line. With the data fixed, this loss is a function of the line’s parameters, m and b: gradient descent updates those parameters, not the data points. section 16.4.1
Figure 16.19 The cost function of the example in figure 16.18 (B). Using the sum of squared errors, the cost is a function of m and b.
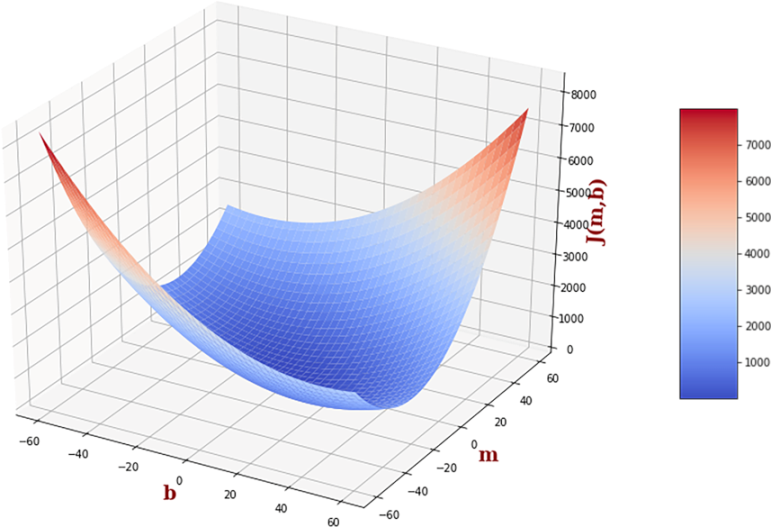
The plotted squared-error cost shows why a model’s parameters, rather than its data points, form the search space for linear regression. section 16.4.1
Choosing a score is not just bookkeeping. Counting edge crossings directly gives a graph drawing a meaningful cost, but produces broad flat regions and abrupt changes as vertices move. A gradient offers little guidance on a plateau, while gradient descent requires a function differentiable near the points where it computes gradients. A smooth, bowl-shaped function with one global minimum is much easier for that algorithm to navigate. section 16.2.1 section 16.2.2 section 16.3.3
Match the objective to both the goal and the search method:
- For a graph drawing, replace a crossing-count objective with distance-based attraction between connected vertices and repulsion between vertices. Squared distances help make the resulting function differentiable; adjustable weights balance the two terms. This aims for a pleasing drawing and improves crossings only indirectly. section 16.5 section 16.5.1
- For gradient descent, compute partial derivatives with respect to each adjustable coordinate or model parameter. In the graph-drawing implementation, an update needs the derivatives, not an explicit evaluation of the cost. Random restarts do need cost evaluations to keep the best result. section 16.4.1 section 16.5.2
- For a step-shaped or discrete search space, consider simulated annealing instead. It can compare candidate costs without differentiating the objective, but computing an expensive cost at every iteration leaves less time for exploration. section 17.1.6
A route objective
For a traveling-salesperson tour, sum the costs of consecutive edges, including the edge back to the start. This directly scores the requested outcome. Equivalent rotations of a closed tour have the same cost, so fixing the starting city reduces a six-city search from 720 permutations to 120 without changing the best tour. section 17.2.1 section 17.2.3