A receiver operating characteristic (ROC) curve evaluates a binary classifier across thresholds by plotting the true positive rate (TPR) against the false positive rate (FPR). For a confusion matrix, TPR = TP/(TP + FN) and FPR = FP/(FP + TN). section 5.2
Interpret the curve through its threshold-dependent operating points:
- Varying the classification threshold produces different TP, FP, FN, and TN values and therefore different ROC points. section 5.2
- Perfect classification reaches TPR = 1 and FPR = 0; performance generally improves toward the upper-left corner. section 5.2
- The diagonal TPR = FPR line represents chance-level performance. section 5.2
- The area under the curve (AUC) summarizes ROC quality; higher values are better, with a maximum of 1. section 5.2
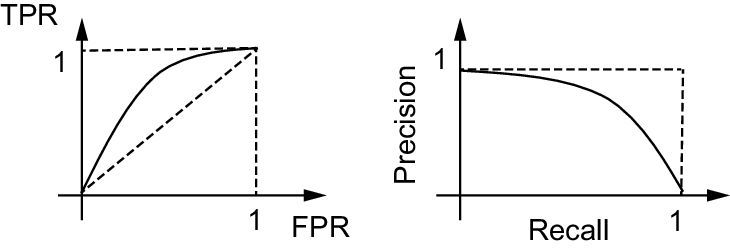
Use the ROC plot alongside the precision-recall plot to compare threshold-based views of classifier performance. section 5.2






