liveBook · Manning

Receiver operating characteristic

As explained in Starting Data Analytics with Generative AI and Python

A plot of true positive rate against false positive rate across classification thresholds.

When a classifier threshold changes, sensitivity and specificity move in opposite directions. The receiver operating characteristic (ROC) curve makes that trade-off visible by plotting true positive rate against false positive rate across thresholds. section 5.5.5

Why both rates matter

A classifier that labels every record positive achieves sensitivity of 1, but also creates many false positives. Use the ROC curve to judge whether that trade-off is acceptable rather than treating high sensitivity as automatically successful. section 5.5.5

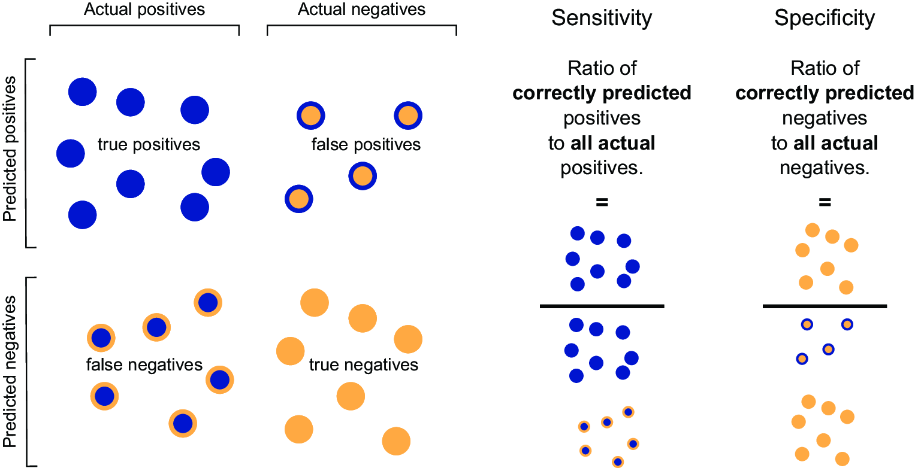
Figure 5.3 Sensitivity and specificity
figure

Use the sensitivity-and-specificity figure to connect ROC axes with the underlying classification trade-off. section 5.5.5


How Starting Data Analytics with Generative AI and Python covers it

How deep it goes
Defines the plotted rates and threshold relationship, then stops short of detailed ROC construction or mathematical derivation.
Examples
Uses an all-positive classifier and a sensitivity-specificity figure to illustrate threshold trade-offs.
What it assumes
Assumes familiarity with binary classification and sensitivity or specificity, while defining the ROC relationship in plain language.
What you can do after
Evaluate classifier effectiveness and make informed threshold decisions by comparing true and false positive rates.
How it connects
Links sensitivity, specificity, false positive rate, classification thresholds, and area under the curve.

Also explained in

Compare how 7 books explain receiver operating characteristic →

Related concepts

This explainer was generated by Manning's knowledge graph from the text of Starting Data Analytics with Generative AI and Python. The section links point to the parts of the book it draws on.




