A receiver operating characteristic (ROC) curve evaluates a binary classifier across decision thresholds by plotting the true positive rate against the false positive rate. The true positive rate is recall, also called sensitivity; the false positive rate measures how often negative molecules are incorrectly labeled positive. section 5.1.3
Use ROC analysis to compare threshold behavior rather than judging a classifier at only 0.5:
- Lowering the threshold generally captures more true positives while also increasing false positives. section 5.1.3
- Compare ROC behavior with precision-recall analysis: ROC emphasizes sensitivity and specificity, whereas precision-recall shows precision and recall. section 5.1.3
- Evaluate the curve against a random baseline when assessing whether predictions improve on chance. section 5.1.3
CYP inhibition screening
A logistic regressor predicts whether a molecule inhibits a cytochrome P450 enzyme. Instead of fixing the classification threshold at 0.5, vary it and plot sensitivity against the false-positive rate to inspect performance across possible screening policies. section 5.1.3 section 5.5
Figure 5.5 PR and ROC curves for the logistic regressor and the random baseline.
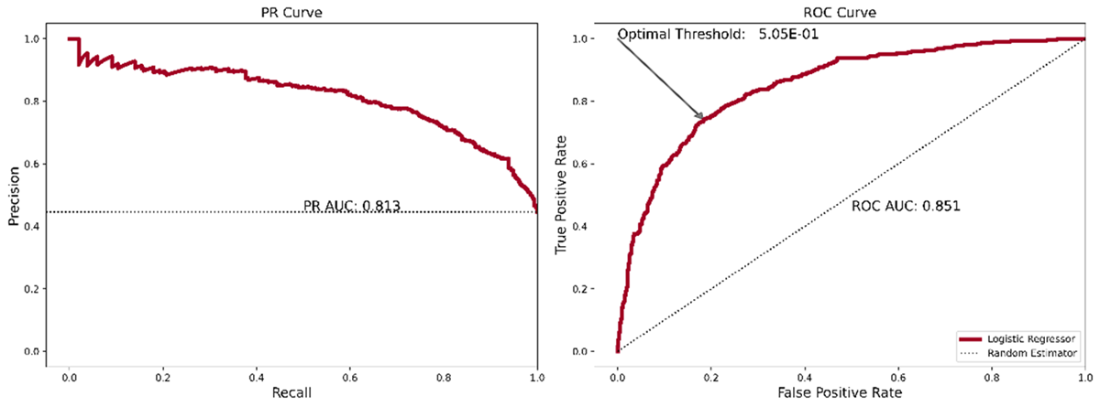
The paired PR and ROC figure provides a visual comparison of threshold trade-offs for a logistic regressor and a random baseline. section 5.1.3








