A sigmoid, or S-curve, describes progress that accelerates, enters a transition, and then slows toward a plateau. The slowdown reflects diminishing returns as constraints become harder to overcome. section 7.1.1 section 9.2.1
The pattern challenges the idea of boundless improvement. More power, data, or computation may improve a system, but practical constraints eventually limit what additional investment achieves. section 7.1.1
Use the S-curve to distinguish several kinds of progress:
- A conventional S-curve reaches a plateau where further improvement provides little meaningful value. section 9.2.1
- An iterative S-curve begins when a new technique opens another period of improvement, even after the previous technique has stalled. section 9.2.1
- Increasing transistor counts does not guarantee equivalent growth in frequency, power efficiency, single-threaded performance, or total computing. section 7.1.1
Technology growth
Moore’s law illustrates why a single growth measure can mislead: transistor counts may keep doubling while total system performance follows an S-curve because other constraints intervene. section 7.1.1
Figure 9.2 The S-curve, or sigmoid, shows the classic plateau behavior: at some point, you hit diminishing returns. The counterpoint to this expressed by the iterative S-curve model is that progress continues past the plateau of diminishing returns by discovering new techniques, each represented by a new S-curve. The new techniques may start worse than the existing methods but have a higher potential to surpass them.
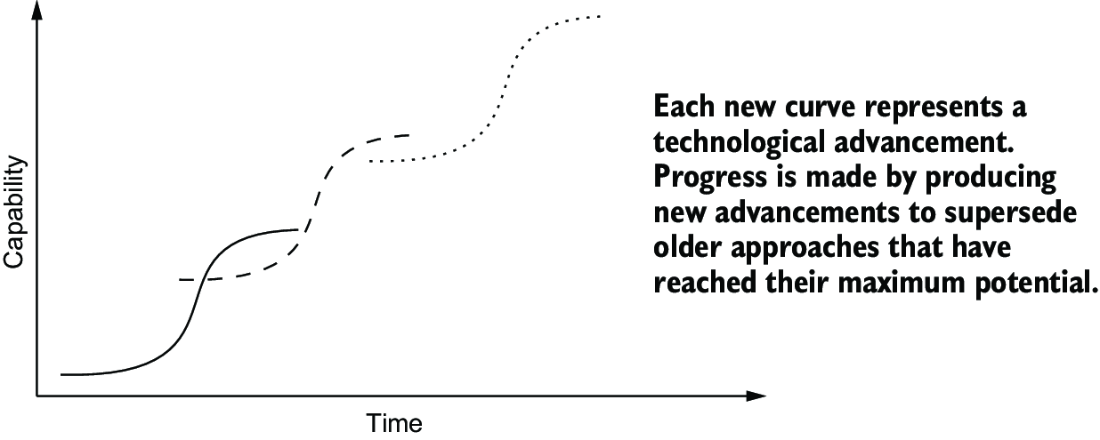
Compare a plateauing sigmoid with successive S-curves created by new techniques. section 9.2.1















