The sigmoid, also called the logistic function, turns a numeric input into a value between 0 and 1. Its S-shaped curve makes it useful in logistic regression: a linear combination of predictors becomes an estimated probability that a binary outcome equals 1. Unlike linear regression, the resulting prediction is a class probability rather than an unrestricted numeric outcome. section 5.1
Figure 5.1 A graphical illustration of the sigmoid function. The sigmoid function is characterized by its S-shaped curve, compared to a linear function, which is characterized by a straight line.
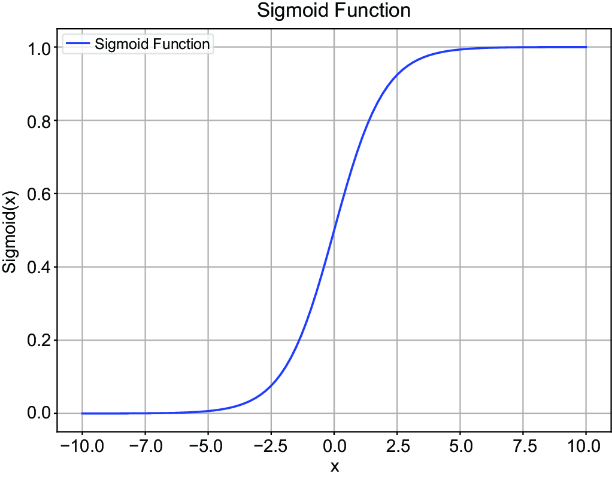
The plotted S-shaped curve shows how the sigmoid differs from the straight line associated with a linear function. section 5.1
Write the sigmoid as p = 1 / (1 + e^(−z)), where z is an intercept plus predictor values multiplied by their fitted coefficients. In a binary model, p represents P(Y = 1 | X). A common decision rule predicts class 1 when p is at least 0.5 and class 0 otherwise. The probability and the final class prediction are distinct outputs: the threshold supplies the decision rule. section 5.1 section 5.2.3
Predicting a raisin class
A fitted model uses raisin measurements to estimate class probability. With its rounded coefficients, the calculation is `z = -11.8048 - 0.0244 * MinorAxisLength + 0.0159 * Perimeter`, followed by `p = 1 / (1 + 2.72**(-z))`. For one raisin, the displayed probability is 0.698821, so the 0.5 rule predicts class 1; its recorded class is 0. That mismatch is a reminder to check predictions against observed outcomes rather than treating a probability above the threshold as proof. section 5.2.3
The sigmoid supplies the probability transformation, not evidence that the fitted model is reliable. Assess logistic regression with model-fit and predictor-significance measures, then examine classification errors and metrics such as accuracy and area under the receiver operating characteristic curve. Exploring the predictors and checking issues such as multicollinearity also matter when selecting a model. section 5.2.2 section 5.3















