A signal is information about a system that can be observed externally. In observability, signals provide the evidence used by people or software to understand and influence a cloud-native system. Logs, metrics, and traces are the three most common signal types. section 1.1 section 2.0
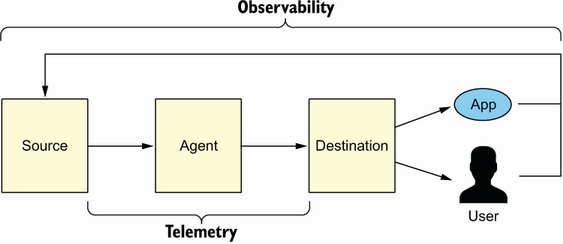
Trace the path from sources that emit signals, through agents that collect and route them, to destinations used for dashboards, alerts, storage, and analytics. section 1.1
Signals differ by what they carry, who controls them, and how they support decisions:
- Numerical signals, such as service-invocation counts, support measurement and baselines; textual signals, such as log lines, require human interpretation. section 2.0
- Owned sources can be instrumented to emit selected signals; dependencies, binaries, and managed services constrain you to consuming predefined signals. section 2.0
- A useful signal yields an actionable insight; unnecessary collection creates noise and increases network, processing, and storage costs. section 2.6
- Selection depends on the task: infrastructure on-call may need CPU, RAM, and filesystem utilization, while API latency work may need network visibility. section 3.1
Echo service
A small Go HTTP echo service provides a practical signal source. Instrument it with logs, metrics, and traces, then inspect the results in Grafana while generating requests with curl or a load-testing tool. Prometheus and Jaeger can provide additional signal tooling. section 2.1